全球领先的新经济产业第三方数据挖掘与分析机构
1.中国酒类行业细分品类市场介绍
2.中国酒类行业发展历程及特点
3.中国酒类行业发展环境分析:经济环境
4.中国酒类行业发展环境分析:社会环境
5.中国酒类行业发展环境分析:技术环境
6.中国酒类行业发展环境分析:政策环境
7.2019中国酒行业商情监测之一
8.2019中国酒行业商情监测之二
9.2019中国酒行业商情监测之三
102019中国酒行业商情监测之四
二、2019-2020中国酒行业市场发展现状概览
1.2019年1-11月中国酒行业生产规模
2.2019年1-4月中国白酒生产区域分布
3.2019年1-4月中国啤酒生产区域分布
4.2019年1-2月中国葡萄酒生产区域分布
5.2019年中国酒类企业品牌价值200强地域分布
6.2019年1-11月中国各类酒销售收入占比
7.2019年1-11月中国酒类消费规模数据分析
8.2019年中国双十一白酒品牌销量TOP10
9.2019年中国双十一啤酒品牌销量TOP10
10.2019年中国双十一葡萄酒品牌销量TOP10
11.2019年中国四大酒类消费场景偏好分析
12.2019年中国酒类行业进口情况
13.2019年中国葡萄酒进口数据分析
14.2019年中国啤酒进口数据分析
15.2019年中国白酒进口数据分析
16.2019年中国白酒、啤酒、葡萄酒出口数据分析
17.2019年1-11月中国酒类行业效益分析
18.中国酒类行业特点
三、2020中国三大酒类标杆企业商业运作案例研究
1.中国20家白酒企业市值对比
2.中国20家白酒企业市值对比
3.中国20家上市白酒企业梯队分布
4.中国四大龙头白酒企业产品力对比
5.中国四大龙头白酒企业经营情况对比
6.中国四大龙头白酒企业偿债能力对比
7.中国四大龙头白酒企业运营能力对比(一)
8.中国四大龙头白酒企业运营能力对比(二)
9.中国四大龙头白酒企业研发能力对比
10.中国四大龙头白酒企业产销量对比
11.中国三大龙头白酒企业高端酒销量对比
12.中国四大龙头白酒企业营销模式对比
13.中国四大龙头白酒企业渠道变革模式总结
14.中国龙头白酒企业市场布局策略分析
15.中国龙头白酒企业产品价位对比
16.中国13家葡萄酒上市企业营收排行
17.中国13家葡萄酒上市企业利润排行
18.中国葡萄酒行业典型企业分析一:张裕集团(一)
19.中国葡萄酒行业典型企业分析一:张裕集团(二)
20.中国葡萄酒行业典型企业分析一:张裕集团(三)
21.中国葡萄酒行业典型企业分析二:通葡股份(一)
22.中国葡萄酒行业典型企业分析二:通葡股份(二)
23.中国葡萄酒行业典型企业分析二:通葡股份(三)
24.中国葡萄酒行业典型企业分析二:通葡股份(四)
25.2019Q3中国啤酒行业龙头企业营收排名
26.中国啤酒行业龙头企业分析一:青岛啤酒(一)
27.中国啤酒行业龙头企业分析一:青岛啤酒(二)
28.中国啤酒行业龙头企业分析一:青岛啤酒(三)
29.中国啤酒行业龙头企业分析二:重庆啤酒(一)
30.中国啤酒行业龙头企业分析二:重庆啤酒(二)
31.中国啤酒行业龙头企业分析二:重庆啤酒(三)
32.中国啤酒行业龙头企业分析二:重庆啤酒(四)
四、2020-2022中国酒行业商业转型与模式创新研究
1.中国酒类行业发展趋势分析(一)
2.中国酒类行业发展趋势分析(二)
3.中国酒类行业发展趋势分析(三)
4.中国酒类行业发展趋势分析(四)
5.中国酒类行业发展趋势分析(五)
6.中国酒类行业发展趋势分析(六)
图表目录
图表1:2013-2019Q3年中国国内生产总值(单位:亿元)
图表2:2013-2018年中国消费对经济增长贡献率
图表3:2019年1-11月中国白酒、葡萄酒、啤酒产量与增速(单位:万千升,%)
图表4:2019年1-4月白酒产量前十省份
图表5:2019年1-4月啤酒产量前十省份
图表6:2019年1-2月葡萄酒产量前十省份
图表7:2019年8月中国各省市酒类企业200强数量(单位:家)
图表8:2019年1-11月中国酒类行业销售收入构成
图表9:2019年1-11月中国白酒、啤酒、葡萄酒销售收入与增速
图表10:2019年“双十一”白酒品牌销量TOP10
图表11:2019年“双十一”葡萄酒品牌销量TOP10
图表12:2019年中国四大酒类消费场景
图表13:2014-2019年1-11月中国酒类进口数量
图表14:2014-2019年1-11月中国酒类进口金额
图表15:2014-2019年1-11月中国葡萄酒进口量及进口金额
图表16:2014-2019年11月中国啤酒进口量及进口金额
图表17:2014-2019年1-10月中国白酒进口量
图表18:2019年1-11月中国白酒、啤酒、葡萄酒出口量及同比增速(单位:万升)
图表19:2019年1-11月中国各类酒行业利润增长率
图表20:2019H1白酒行业上市企业TOP4酒类对比
图表21:2019Q3白酒行业上市企业TOP4经营情况
图表22:2016-2019Q3年白酒行业上市企业TOP4资产负债率对比(%)
图表23:2016-2019Q3年白酒行业上市企业TOP4总资产周转率对比
图表24:2016-2019Q3年白酒行业上市企业TOP4应收帐款周转天数对比
图表25:2017-2019Q3年白酒行业上市企业TOP4研发费用对比(单位:万元)
图表26:2015-2018年白酒行业上市企业TOP4酒类产销量对比
图表27:2016-2018年贵州茅台、五粮液、泸州老窖高端酒销量对比(单位:万吨)
图表28:2015-2019年各上市白酒企业提价分布
图表29:2018H1-2019H1张裕集团营收情况
图表30:2019H1张裕集团主营业务构成(单位:亿元)
图表31:“张裕集团”网络口碑
图表32:“张裕集团”主题词云
图表33:张裕葡萄酒产品价格区间分布(部分)
图表34:2018Q3-2019Q3通葡股份营收情况
图表35:2019Q3通葡股份主营业务构成
图表36:2019Q3通葡股份各档产品及渠道销售收入(万元)
图表37:2019Q3通葡股份东北地区营收
图表38:“通葡股份”网络口碑
图表39:“通葡股份”情感比例
图表40:2019Q3中国啤酒龙头企业营收排名
图表41:2007-2019Q3青岛啤酒营收情况
图表42:“青岛啤酒”网络口碑和网络热度指数
图表43:2014-2018年青岛啤酒吨位价格
图表44:青岛啤酒产品结构
图表45:近年重庆啤酒产能优化情况
图表46:2009-2019Q3重庆啤酒营收情况
图表47:2019Q3重庆啤酒产品结构
图表48:“重庆啤酒”网络口碑
图表49:“重庆啤酒”情感比例
图表50:2016-2018年茅台、五粮液、洋河三大龙头的市场份额总额
图表51:2013-2018年啤酒市场主要品牌市场份额变动情况
图表52:2016年10月-2019年11月中国啤酒、白酒、葡萄酒产量趋势图
图表53:2013-2020年中国酒类电商交易规模及预测
图表54:2019年中国四大酒类消费者平均年龄分布
图表55:2018-2023年中国精酿市场规模及预测
图表56:2019年1-10月中国进口国际烈酒一览
contents
Figure1:China's GDP from 2013-2019Q3 (100 million RMB)
Figure2:China's consumption contribution to economic growth from 2013-2018
Figure3:China liquor, wine, beer production and growth rate from Jan. to Nov. 2019 (10 thousand liters,%)
Figure4:The top ten provinces in terms of liquor production from Jan.-Apr. 2019
Figure5:The top ten provinces in terms of beer production from Jan.-Apr. 2019
Figure6:The top ten provinces in terms of wine production from Jan.-Feb. 2019
Figure7:Number of top 200 wine companies in various provinces and cities in China in 2018
Figure8:Composition ratio of sales revenue of various alcoholic beverages in China's brewing industry in 2018
Figure9:Chinese liquor, wine, beer revenue and growth rate from Jan. to Nov. 2019
Figure10:TOP10 Chinese liquor brand sales in Nov.11 2019
Figure11:TOP10 Chinese wine brand sales in Nov.11 2019
Figure12:The four major alcohol consumption scenarios in China in 2019
Figure13:China's wine imports from 2014- Nov. 2019
Figure14:China's import amount on liqueur from 2014-Nov.2019
Figure15: Import volume and import value of Chinese wind from 2014-Nov.2019
Figure16: Import volume and import value of Chinese beer from 2014-Nov.2019
Figure17: Import volume and import value of Chinese liquor from 2014-Oct.2019
Figure18: Export volume of Chinese liquor , beer and wine from Jan.-Nov.2019(10 thousand liters)
Figure19:Profit growth rate of various Chinese liqueur companies in 2018
Figure20:Comparison of TOP4 liquors of listed companies in the liquor industry in 2019H1
Figure21:TOP4 operating status of listed companies in the liquor industry in 2019Q3
Figure22:Comparison of TOP4 asset-liability ratio of listed companies in the liquor industry during 2016-2018(%)
Figure23:Comparison of TOP4 total asset turn over of listed companies in the liquor industry during 2016-2018
Figure24:Comparison of turnover days of TOP4 receivables of listed companies in the liquor industry from 2016 to 2019Q3
Figure25:Comparison of TOP4 R & D expenses of listed companies in the liquor industry during 2016-2018(10 thousand RMB)
Figure26:Comparison of alcohol production and sales of three companies listed from 2015 to 2018
Figure27:Comparison of high-end wine sales in Maotai, Wuliangye, and Luzhou Laojiao from 2016 to 2018(10 thousand tons)
Figure28:Price increase distribution of listed liquor companies during 2015-2019
Figure29:Revenue of Changyu Group during 2018H1-2019H1
Figure30:2019H1 Changyu Group's main business composition (100 million RMB)
Figure31:\"Changyu Group\" network word of mouth
Figure32:\"Changyu Group\" keyword cloud
Figure33:Price distribution of Changyu wine products
Figure34:Tonghua Winery revenue during 2018Q3-2019Q3
Figure35:The main business composition of Tonghua Winery in Q3 2019
Figure36:Sales of various products and channels of Tonghua Winery in Q3 2019 (10 thousand RMB)
Figure37:2019Q3 Tonghua Winery revenue in northeast China
Figure38:“Tonghua Winery\" network word of mouth
Figure39:\"Tonghua Winery\" emotional ratio
Figure40:Revenue Ranking of China's Leading Beer Companies in Q3 2019
Figure41:Revenue of Tsingtao Brewery, 2007-2019Q3
Figure42:“Tsingtao Brewery\" network word of mouth internet heat regional index
Figure43:2014-2018 Tsingtao beer tonnage price
Figure44:Product structure of Tsingtao beer
Figure45:Optimization of beer production capacity in Chongqing in recent years
Figure46:Revenue of Chongqing Beer, 2009-2019Q3
Figure47:Product structure of Chongqing Beer in 2019Q3
Figure48:“Chongqing Beer \" network word of mouth
Figure49:\" Chongqing Beer\" emotional ratio
Figure50:Total market share of the three leading players of Moutai, Wuliangye and Yanghe from 2016 to 2018
Figure51:Changes in market share of major brands in the beer market, 2013-2018
Figure52:China's beer, liquor, and wine production trends from Oct. 2016 to Nov. 2019
Figure53:2013-2019 China's wine E-commerce transaction scale and forecast
Figure54:Average age distribution of China's four largest alcohol consumers in 2019
Figure55:Market size and forecast of Chinese fine brewing in 2018-2023
Figure56:Amount of international spirits imported by China from Jan.-Oct. 2019
","groupId":0,"discount":"1.0","srcFile":"","iimediaUrl":"http://www.iimedia.cn/68063.html","readCount":7178,"reportType":0,"reportAuthor":"艾媒生活与出行产业研究中心","activityId":0,"isSubscribed":0,"activityTitle":"","price":10999.0,"id":38976,"isShowDownload":0,"reportLbImg":["http://img.iimedia.cn/100017a7c37e99c1448e4f9ef8210276ffe4f1352309dfb0e09565ea296fe141e8419","http://img.iimedia.cn/100018f811aef30eb1fa66df93bb7277db1e77692137c6d8583fb1b9eedc9b15dff7a","http://img.iimedia.cn/000016aaea1978b4339725cf6f824e5d94e10666e8fa4e6d9d698c679fd33cc180ff4","http://img.iimedia.cn/1000131198a1fc46b96283598f24973759e26ad53bcf2b1a225880f40b2b2ffee8add","http://img.iimedia.cn/100013830622546c85a6aebe2f55c85998e47bc24efc30d26d6dcd2e06bc2631e943c"],"publishTime":1579073610000,"visit_count":132690,"hasFile":1,"fileSize":5749122,"titleLevel":"酒类行业","couponList":[],"shareUrl":"https://report.iimedia.cn/m-report.jsp?forWxShare=1&reportId=38976&sCode=BFAA231D87903BD9C1B0CDCADBCE4141&extT=","img":"https://img.iimedia.cn/00001274b1a490eddf276368e3ae423a855051c2a9048dee8c92c28017e5956e5632e","groupType":0,"vipReportInfo":[{"id":62999,"raw":0,"payMode":1,"reportType":0,"pages":0,"equipType":0,"isOrderByIn":0,"toInfoPage":0,"offset":0,"count":10,"hasFile":0,"page":1,"isNewSearch":0,"title":"艾媒咨询 | 2025年中国电商“双十一”消费大数据监测报告","total":0,"op":0,"moduleType":3},{"id":57853,"raw":0,"payMode":1,"reportType":0,"pages":0,"equipType":0,"isOrderByIn":0,"toInfoPage":0,"offset":0,"count":10,"hasFile":0,"page":1,"isNewSearch":0,"title":"艾媒咨询 | 2025-2026年中国本地生活服务市场竞争格局和消费调查研究报告","total":0,"op":0,"moduleType":3},{"id":57852,"raw":0,"payMode":1,"reportType":0,"pages":0,"equipType":0,"isOrderByIn":0,"toInfoPage":0,"offset":0,"count":10,"hasFile":0,"page":1,"isNewSearch":0,"title":"艾媒咨询 | 2025年中国高考及院校录取分数大数据分析报告","total":0,"op":0,"moduleType":3},{"id":46744,"raw":0,"payMode":1,"reportType":0,"pages":0,"equipType":0,"isOrderByIn":0,"toInfoPage":0,"offset":0,"count":10,"hasFile":0,"page":1,"isNewSearch":0,"title":"艾媒咨询 | 2025年中国年份普洱茶行业现状及消费趋势洞察报告","total":0,"op":0,"moduleType":3},{"id":46687,"raw":0,"payMode":1,"reportType":0,"pages":0,"equipType":0,"isOrderByIn":0,"toInfoPage":0,"offset":0,"count":10,"hasFile":0,"page":1,"isNewSearch":0,"title":"艾媒咨询 | 2025年中国月子中心消费者行为调查数据","total":0,"op":0,"moduleType":3},{"id":46688,"raw":0,"payMode":1,"reportType":0,"pages":0,"equipType":0,"isOrderByIn":0,"toInfoPage":0,"offset":0,"count":10,"hasFile":0,"page":1,"isNewSearch":0,"title":"艾媒咨询 | 2025年中国预制鸡排消费行为调查数据","total":0,"op":0,"moduleType":3},{"id":46689,"raw":0,"payMode":1,"reportType":0,"pages":0,"equipType":0,"isOrderByIn":0,"toInfoPage":0,"offset":0,"count":10,"hasFile":0,"page":1,"isNewSearch":0,"title":"艾媒咨询 | 2025年中国服饰产品消费行为调查数据","total":0,"op":0,"moduleType":3},{"id":46690,"raw":0,"payMode":1,"reportType":0,"pages":0,"equipType":0,"isOrderByIn":0,"toInfoPage":0,"offset":0,"count":10,"hasFile":0,"page":1,"isNewSearch":0,"title":"艾媒咨询 | 2025年中国小程序电商用户消费行为调查数据","total":0,"op":0,"moduleType":3},{"id":46685,"raw":0,"payMode":1,"reportType":0,"pages":0,"equipType":0,"isOrderByIn":0,"toInfoPage":0,"offset":0,"count":10,"hasFile":0,"page":1,"isNewSearch":0,"title":"艾媒咨询 | 2025年中国第三方网络招聘平台使用行为调查数据","total":0,"op":0,"moduleType":3},{"id":46684,"raw":0,"payMode":1,"reportType":0,"pages":0,"equipType":0,"isOrderByIn":0,"toInfoPage":0,"offset":0,"count":10,"hasFile":0,"page":1,"isNewSearch":0,"title":"艾媒咨询 | 2025年中国化妆品消费者行为调查数据","total":0,"op":0,"moduleType":3}],"discountPrice":2699.0,"vipDiscountPrice":1619.4,"title":"艾媒报告|2020-2021年中国酒类行业发展状况与竞争态势分析报告","reportGroupList":"","isDeleted":0,"typeList":[{"typeName":"行业研究报告","id":1}],"imContent":"
2020年1月15日,全球新经济产业第三方数据挖掘和分析机构iiMedia Research(艾媒咨询) 发布《2020-2021年中国酒类行业发展状况与竞争态势分析报告》。报告根据艾媒咨询商业情报数据库、北极星互联网产品分析系统、艾媒商情舆情数据监测系统基础数据,将青岛啤酒、重庆啤酒、通葡股份、张裕集团、贵州茅台、五粮液、泸州老窖、洋河股份等酒类上市公司作为典型案例进行商情分析,深入研究中国三大酒类商业运作模式。iiMedia Research(艾媒咨询)数据显示,2019年1-11月规模以上企业白酒产量698.0万千升(折65度,商品量),同比增长0.5%;啤酒产量3524.7万千升,同比增长1.0%;葡萄酒产量37.2万千升,同比下降12.1%。葡萄酒产量出现显著下滑,与进口葡萄酒的竞争和挤压有关。(《2020-2021年中国酒类行业发展状况与竞争态势分析报告》完整高清PDF版共84页,可点击文章右侧浏览高清报告按钮进行报告浏览)
\r\n报告介绍:《2020-2021年中国酒类行业发展状况与竞争态势分析报告》主要对中国酒类行业发展现状、发展环境、市场消费规模、生产规模、酒类商业衍变、商业转型及模式创新等方面进行数据分析研究,深入探讨中国三大酒类商业运作模式,预测2020-2021年中国酒类行业发展趋势。艾媒咨询分析师认为,在“互联网+流通”的催化加速下,智慧物流、智慧仓储、智慧商圈快速兴起,改变了商贸流通的传统形态,催生了流通新业态、新模式。新的流通技术、流通设施、流通模式出现,为酒类流通企业开展模式创造了条件,尤其是有利于在电子商务、产品追溯、营销推广、支付服务、售后服务、供应链管理等领域开展创新。
\r\n本报告研究涉及企业/品牌/案例:青岛啤酒,重庆啤酒,通葡股份,张裕集团,贵州茅台,五粮液,泸州老窖,洋河股份,华致酒行,中粮酒业,山西汾酒,百威,威龙葡萄酒,酒鬼酒,哈尔滨啤酒,福佳,雪花啤酒,燕京啤酒,喜力,凯旋1664,科罗娜,爱士堡,奔富,长城,拉菲,张裕,黄尾袋鼠,杰卡斯,干露,智象,王朝,桃乐丝,古井贡酒,今世缘,顺鑫农业,口子窖,水井坊,迎驾贡酒,老白干酒,舍得酒业,金徽酒,伊力特,青青稞酒,金种子酒,ST岩石,ST皇台,青花汾酒,舍得,洋河梦之蓝,沱牌系列,口子窖,老白干青花,今世缘,金徽酒,通葡股份,西部创业,通天酒业,ST中葡股份,莫高股份,楼兰酒庄,怡园酒业,伊珠股份,芳香庄园,珠江啤酒,重庆啤酒,惠泉啤酒,兰州黄河,ST西发等。
\r\n报告核心观点:
\r\n中国酒类生产体量大,市场消费规模持续扩大
\r\n从产量来看,白酒、啤酒产量微量增长,葡萄酒产量持续下滑。2019年1-11月,规模以上白酒企业产量698万千升,啤酒产量3524.7万千升,同比增速分别为0.5%和1%;葡萄酒产量37.2万千升,同比下降12.1%。
\r\n从消费来看,市场需求上升,酒类消费规模持续扩大,利润空间可观。2019年1-8月,酒类消费规模5487亿元,增长8.06%;实现利润1045亿元,增长18.70%。
\r\n中国白酒、啤酒行业持续盈利,葡萄酒行业营收惨淡
\r\n白酒行业贵州茅台遥遥领先,但五粮液、洋河股份、泸州老窖等第二、三梯队企业也紧追不舍,纷纷提价抢占中高端市场;啤酒行业产量最高、售价较低,市场需求大,青岛啤酒、燕京啤酒等五家本土啤酒企业在今年前三季度都实现了营收和净利润的双上涨;与之相反,葡萄酒行业整体市场营收情况惨淡,过半上市企业出现营收和净利润同时下降,国内葡萄酒龙头企业张裕集团也不能避免。
\r\n中国酒类消费主体逐步年轻化,消费场景酒类偏好不同
\r\n2019年中国白酒消费者平均年龄为37岁,而啤酒、洋酒、葡萄酒的消费者平均年龄为34岁。随着年轻一代崛起,80、90后逐步成为酒类消费的主体。此外,不同消费场景有不同的饮酒偏好。酒类消费者宴请场合偏好白酒和葡萄酒,送礼偏好洋酒和白酒,自饮偏好葡萄酒和啤酒,收藏偏好洋酒和葡萄酒。
\r\n行业背景概况(节选):
\r\n中国酒类行业细分品类市场介绍
\r\n酒类行业主要包括白酒制造、啤酒制造、葡萄酒制造、黄酒制造及其他酒制造行业。
\r\n中国酒类行业发展历程及特点
\r\n改革开放以来,中国酒类流通行业发展经历了如下四个阶段:
\r\n市场数据分析(节选):
\r\n2019年1-11月中国白酒、葡萄酒、啤酒产量与增速
\r\n2019年1-11月规模以上企业白酒产量698.0万千升(折65度,商品量),同比增长0.5%;啤酒产量3524.7万千升,同比增长1.0%;葡萄酒产量37.2万千升,同比下降12.1%,这已是国产葡萄酒产量今年以来连续第9个月出现负增长。艾媒咨询分析师认为,2019年中国白酒、啤酒生产相对平稳,但国产葡萄酒产量出现显著下滑,与进口葡萄酒的竞争和挤压有关;葡萄酒的消费以中产为主,对品质要求相对较高。
\r\n2019年1-11月中国白酒、啤酒、葡萄酒销售收入与增速
\r\n2019年1-11月,白酒、啤酒、葡萄酒行业规模以上企业销售收入分别为4927.4亿元、1466.2亿元、125.3亿元,同比增速分别为19.9%,18.3%和-49.0%。艾媒咨询分析师认为,白酒、啤酒的习惯饮用者依然是现在市场的酒水饮用主力,葡萄酒的主流消费群虽然在放大,但还没有成为真正的主力。
\r\n行业趋势分析(节选):
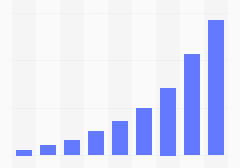
\r\n2013-2020年中国酒类电商交易规模及预测
\r\n根据中国烟酒行业协会数据显示,2013 年酒类电商交易规模达 70 亿元,2018年达到了 767 亿元,而经过预测,2020 年电商交易规模将突破 1000 亿元。艾媒咨询分析师认为,过去几年中,酒类电商呈现量级增长,市场需求的剧增以及新零售业态发展促使酒类电商平台快速发展。
\r\n2019年中国四大酒类消费者平均年龄分布
\r\n2019年四大酒类消费者平均年龄约为35岁,消费主体呈现出年轻化的趋势。艾媒咨询分析师认为,年轻消费主体的消费观和价值观呈现出个性化和多元化色彩,这种消费代际的新特点将促使酒类行业重构新的价值标准体系,在品牌塑造、产品塑造、价值观塑造、营销模式和创新推广都会迎合80、90后消费者进行变革。
\r\n本文内容节选自艾媒咨询发布的《艾媒报告|2020-2021年中国酒类行业发展状况与竞争态势分析报告》,完整版报告共84页,点击文末下方链接可直达完整版报告。
","chartNum":56,"categoryList":[{"id":201,"categoryName":"酒类"}],"isShowOnLineReadUrl":"","summary":"2020年1月14日,全球知名的新经济产业第三方数据挖掘和分析机构iiMedia Research(艾媒咨询) 发布《2020-2021年中国酒类行业发展状况与竞争态势分析报告》。iiMedia Research(艾媒咨询)数据显示,2019年1-11月规模以上企业白酒产量698.0万千升(折65度,商品量),同比增长0.5%;啤酒产量3524.7万千升,同比增长1.0%。","shareUrlQrCode":"data:image/png;base64,iVBORw0KGgoAAAANSUhEUgAAAMgAAADICAYAAACtWK6eAAAFB0lEQVR42u3dS47cOgwF0N7/pl/mAd4gaJG8pM8FMqpOfWweA5Rk+ec/Efnf/DgEIoCIACICiAggIoCIACICiAggIoCICCAigIgAIgKICCAigIgAIgLI32/089P677ff71+///Tv/e3xef16+vECBBBAAAEEEEAAAeR7QJ43S48L/PUJrD4eacBfA0ytP0AAAQQQQAABBBBA9gLZXnDVTedvf2/18U87noAAAggggAACCCCAADJ9ANLfv7vAui8wgAACCCCAAAIIIIAA8vUm/fVEYff3ef19qycWrw3iAAIIIIAAAggggABisWL3Yr3qAq1usqcXD6bVByCAAAIIIIAAAggg94Fs35TA67Wv29UEEK8DAojXAQHE64BcT1pT/vrz0n/P2roBBBBAAAEEEEAAASQWSHcTPl1A6RuvTS/+23YDGCCAAAIIIIAAAggg+4GkNaXVTeq2Aq6+AL6+4EwNMgACCCCAAAIIIIAAsnex4nTTXF3gr5vW6gKYLtgtE5WAAAIIIIAAAggggOQCmW6Kuzc2S2uKr0+0Vg8SAQIIIIAAAggggACyD0g3gNcFntbUp/3/bnDnN68GBBBAAAEEEEAAAaQdyLYmu7vJnP681xfA6fcHBBBAAAEEEEAAAeT+RGF6wUw3gd0XgOrFkBYrAgIIIIAAAggggACS1qRvu4Gpu+C7b5CaBp06MQgIIIAAAggggAACyB4g5c1S80Mgr20qMb2Z9jRwQAABBBBAAAEEEEDuAUnf+Ky6oNMW/70u+G0XJEAAAQQQQAABBBBAvgeke6Jq+oaotAfydF/Atiw+BAQQQAABBBBAAAEEkKkTPr1Zc/Xv336BO7+rCSCAAAIIIIAAAggg9c3O8MRQWgFtm1jcvtgTEEAAAQQQQAABBJB7QNIemFPdJE4D7S7IaXDnR7EAAQQQQAABBBBAACkHUn3DUvcgQ9pDRqvP1+sLUOpiR0AAAQQQQAABBBBAcoF0T7ylN/HVINMHDabPFyCAAAIIIIAAAggg94F0bwKQNrHYfTyuDXqkNvWAAAIIIIAAAggggOy9Jz296e0eNJjemG76ApW6OBEQQAABBBBAAAEEkO/Mg6Q9oOb1CereCG96Yi5tkAMQQAABBBBAAAEEkHtA0pr89IdGXruBarrJPjdRCAgggAACCCCAAAJI+Q9ImxhL+/vuQZDpC8bnd3cHBBBAAAEEEEAAASSu6eqeOKo+YemLGasXd6Yu3gQEEEAAAQQQQAABZC+Q6Y3Kug/49ETf9A1K1cevbXAJEEAAAQQQQAABBJDPzIOkgd3+AJn0QQ0P8QQEEEAAAQQQQAABpLoguzdT7t7UYHqz6en3SxsUAQQQQAABBBBAAAHkHpC0pjytoKab2rSHpqZ9PiCAAAIIIIAAAggg+5v07iYubfFf2uLM7vO1BQAggAACCCCAAAIIIHeAVDfh2wus+3imnZ/u8wsIIIAAAggggAACyPeApDV56ZtJVxdwetP/uSYdEEAAAQQQQAABBJDzQF4XRHcTmga+O5p0QAABBBBAAAEEEEDSgHRPjE1fANLOR/cFTpMOCCCAAAIIIIAAAkh1Qb4GMv336ZtZd0+UpoABBBBAAAEEEEAAAWQPkOlNAdI3MpveTDt9I7iUAAIIIIAAAggggACSC0TkYgARAUQEEBFARAARAUQEEBFARAARAUREABEBRAQQEUBEABEBRAQQkTP5A/snFo4qZJnKAAAAAElFTkSuQmCC","module_type":1,"memberPrice":2699.0,"introduce":"本报告研究涉及企业/品牌/案例:张裕集团,通葡股份,青岛啤酒,重庆啤酒;其他提及企业/品牌:贵州茅台,五粮液,泸州老窖,洋河股份,华致酒行,中粮酒业,山西汾酒,百威,威龙葡萄酒,酒鬼酒,哈尔滨啤酒,福佳,雪花啤酒,燕京啤酒,喜力,凯旋1664,科罗娜,爱士堡,奔富,长城,拉菲,张裕,黄尾袋鼠,杰卡斯,干露,智象,王朝,桃乐丝,古井贡酒,今世缘,顺鑫农业,口子窖,水井坊,迎驾贡酒,老白干酒,舍得酒业,金徽酒,伊力特,青青稞酒,金种子酒,ST岩石,ST皇台,青花汾酒,舍得,洋河梦之蓝,沱牌系列,口子窖,老白干青花,今世缘,金徽酒,通葡股份,西部创业,通天酒业,ST中葡股份,莫高股份,楼兰酒庄,怡园酒业,伊珠股份,芳香庄园,珠江啤酒,重庆啤酒,惠泉啤酒,兰州黄河,ST西发等。2020年1月15日,全球知名的新经济产业第三方数据挖掘和分析机构iiMedia Research(艾媒咨询) 发布《2020-2021年中国酒类行业发展状况与竞争态势分析报告》。报告根据艾媒咨询商业情报数据库、北极星互联网产品分析系统、艾媒商情舆情数据监测系统基础数据,将青岛啤酒、重庆啤酒、通葡股份、张裕集团、贵州茅台、五粮液、泸州老窖、洋河股份等酒类上市公司作为典型案例进行商情分析,深入研究中国三大酒类商业运作模式。iiMedia Research(艾媒咨询)数据显示,2019年1-11月规模以上企业白酒产量698.0万千升(折65度,商品量),同比增长0.5%;啤酒产量3524.7万千升,同比增长1.0%;葡萄酒产量37.2万千升,同比下降12.1%。葡萄酒产量出现显著下滑,与进口葡萄酒的竞争和挤压有关。
The report includes Tsingtao Beer, Chongqing Beer, Tongpu, Changyu Group, Guizhou Maotai, Wuliangye, Luzhou Laojiao, Yanghe As a typical case, listed liquor companies such as stocks conduct business analysis, and in-depth study of China's three major liquor business operation models. According to data from iiMedia Research, from January to November 2019, the liquor production of enterprises above the designated size was 6.978 million kiloliters (65 degrees off, commodity volume), a year-on-year increase of 0.5%; beer production was 35.247 million kiloliters, a year-on-year increase of 1.0%. ; Wine output was 372,000 thousand liters, a year-on-year decrease of 12.1%. The significant decline in wine production is related to competition and squeeze from imported wines.","isPublished":1,"filePath":"20200115/【完整版】2020-2021年中国酒类行业发展状况与竞争态势分析报告20200114 V3.pdf","updateTime":1733305848000,"pageNum":84,"labelList":[{"id":6466,"labelName":"酒类"},{"id":10318,"labelName":"快消品"},{"id":12324,"labelName":"餐饮综合"},{"id":908,"labelName":"餐饮"},{"id":4455,"labelName":"白酒"},{"id":5425,"labelName":"啤酒"},{"id":4531,"labelName":"葡萄酒"},{"id":11279,"labelName":"红酒"},{"id":10116,"labelName":"洋酒"},{"id":7987,"labelName":"青岛啤酒"},{"id":12746,"labelName":"重庆啤酒"},{"id":12747,"labelName":"通葡股份"},{"id":12748,"labelName":"张裕集团"},{"id":11242,"labelName":"贵州茅台"},{"id":9609,"labelName":"五粮液"},{"id":8802,"labelName":"泸州老窖"},{"id":8576,"labelName":"洋河股份"},{"id":12749,"labelName":"华致酒行"},{"id":12750,"labelName":"中粮酒业"},{"id":12751,"labelName":"山西汾酒"},{"id":12752,"labelName":"百威"},{"id":12753,"labelName":"威龙葡萄酒"},{"id":12754,"labelName":"酒鬼酒"},{"id":12755,"labelName":"哈尔滨啤酒"},{"id":12756,"labelName":"福佳"},{"id":12757,"labelName":"雪花啤酒"},{"id":12758,"labelName":"燕京啤酒"},{"id":12759,"labelName":"喜力"},{"id":12760,"labelName":"凯旋1664"},{"id":12761,"labelName":"科罗娜"},{"id":12762,"labelName":"爱士堡"},{"id":12763,"labelName":"奔富"},{"id":8614,"labelName":"长城"},{"id":14721,"labelName":"啤酒产能"},{"id":14722,"labelName":"精酿"},{"id":14723,"labelName":"烈酒"}],"isShowOnLineRead":0,"seourl":"https://report.iimedia.cn/repo201-0/38976.html","showPrice":10999.0,"createTime":1578993526000,"freePages":10,"md5":"23ebbdf549cb3f97d0a7a54d5d6d235c"},"isInShopCart":0,"acList":[],"isCollectCategory":false,"isCollected":0,"isBought":0},"isStop":0,"name":"艾媒报告|2020-2021年中国酒类行业发展状况与竞争态势分析报告"}, industryInfo={nodeStat=0, name=餐饮食品, is_end=0, pid=31026926, type=7, name_id=null, node_id=44278057, sort_id=3}, nodeInfo={name=艾媒报告|2020-2021年中国酒类行业发展状况与竞争态势分析报告, isCollect=0, isSub=0, type=5, nodeId=30405465}}}}" />
短信登录
中国+86
中国+86
一周内保持登录创建/忘记密码?
- {{ item.name }}

地址:
中国. 广州大学城
总机:
020-8922-4700
数据背书
用数据说话,为增长导航
范围:市场地位证明;联合白皮书;品宣报告;标杆案例;竞争情报;奖项参与等相关事项咨询
例如:大数据验证全球/全国销量(额)第一/领先;品类首创/开创者;第一品牌等市场地位确认服务;数据/报告的第三方背书用途(品宣方向)
180-2235-3365
艾媒智库
范围:会员购买;消费调查;商城报告;内参报告定制等相关事项咨询
例如:想了解商城报告/数据/会员的购买疑问;用户(消费)行为调查;定制内部决策用报告(内参方向)
020-8922-4416 或 181-0273-0697
加入社群
加入艾媒行业实名交流群,获取最新市场咨询、行业数据、合作资源;
目前已开通新科技、新消费及大文娱、大健康、新零售、未来教育、餐饮、快消等超10大领域产业链社群,欢迎业界人士加入。
媒体合作
艾媒分析师记者采访、媒体约稿;内容转载授权;媒体资源置换合作。
news@iimedia.cn
网站投稿
用于投稿、新闻线索收集、爆料及同类信息交互需求,为用户提供便捷的内容提交与反馈通道。
news@iimedia.cn
订阅邮件
50W+ 行业精英每周必读的行业数据报告
行业大类选择我们将会根据您的喜好为您定向推送内容。
邮箱我们将会根据您的喜好为您定向推送内容。
搜索热词:


{{ userDotCount > 99 ? '99+' : userDotCount }}
![]()
![]()
智库VIP
未开通开通会员,免费浏览海量数据
-
报告中心
-
我的收藏
-
我的发票
-
个人中心
{{ userDotCount > 99 ? '99+' : userDotCount }} -
金鹰计划
-
帮助中心


点击按相关度搜索
展示停更数据
 会员数据
会员数据
所属行业:餐饮食品


根据CC准则,此许可证向用户授予以下权利:署名来源;禁止修改;允许商业转载。Attribution-NoDerivatives
4.0国际公共许可证
更多信息
在线咨询
刷新图表
标题设置
字体大小
数值显示
刻度设置
图片属性
- 图表
- 列表
- 媒体图表
下载
PNG
XLS
PPT
显示数值
联合logo
图表展示:
全部时间
- 全部时间
- 最近一周
- 最近一月
- 最近半年
- 最近一年
- 最近三年
- 最近五年
图表展示:
图表展示:
(拖动上方滑块改变图表横轴范围)
去投融数据库看详细数据 >>
多年同列只支持月频或季频指标
| 时间 | 数据(亿元) |
|---|
| 最近浏览数据 | 更新频度 | 单位 | 来源 | 最新数据 | 更新时间 | 注释说明 | 轴线设置 | 线形设置 | 颜色设置 | 设置 |
|---|
查看更多
其他相关数据