全球领先的新经济产业第三方数据挖掘与分析机构
1.中国茶叶分类介绍
2.中国基本茶类介绍
3.中国茶叶行业发展政策背景分析
4.中国茶叶行业发展经济背景分析(一)
5.中国茶叶行业发展经济背景分析(二)
6.中国茶叶行业发展经济背景分析(三)
7.中国茶叶行业发展社会背景分析(一)
8.中国茶叶行业发展社会背景分析(二)
9.中国茶叶行业商情舆情监测分析
10.2017-2027年中国茶叶行业市场规模及预测
二、中国茶叶行业产业链分析
1.中国茶叶产业链结构
2.中国茶叶产业链分析:原料生产环节
(1)2010-2021年中国茶叶产量数据分析
(2)2021年中国主要产茶省茶园种植面积分析
(3)2021年中国茶叶百强县名单TOP10
(4)茶叶百强县案例一:河南信阳县(一)
(5)茶叶百强县案例一:河南信阳县(二)
(6)茶叶百强县案例二:贵州湄潭县(一)
(7)茶叶百强县案例二:贵州湄潭县(二)
(8)茶叶百强县案例三:福建武夷山市(一)
(9)茶叶百强县案例三:福建武夷山市(二)
3.中国茶叶产业链分析:加工制作环节
(1)2021年中国干毛茶总产量
(2)2021年中国主要产茶省份干毛茶产值
(3)2020-2021年中国不同茶叶种类产量数据分析
(4)2019-2022年中国茶叶出厂价格指数
4.中国茶叶产业链分析:销售环节
(1)2013-2021年中国茶叶内销总量数据
(2)2022年中国春茶成交价格
(3)2021年中国不同茶叶种类销量数据
(4)2017-2023年中国茶叶线上市场规模及预测
(5)2016-2021年中国茶叶进口量及进口额分析
(6)2020H1-2021年中国茶类进口比例对比分析
(7)2021年中国茶叶进口国家TOP5
(8)2001-2021年9月中国茶叶出口数量分析
(9)2021年中国茶叶出口种类及出口国家/地区TOP10
三、中国茶叶礼盒市场发展背景分析
1.中国茶叶礼盒市场发展背景:经济
2.中国茶叶礼盒市场发展背景:社会
3.2017-2023年中国茶叶礼盒市场规模
4.茶叶礼盒市场供给
5.茶叶礼盒行业图谱
四、中国茶叶消费行为调研分析
1.中国茶叶消费者画像
2.中国消费者喝茶频率
3.中国消费者喝茶的主要原因
4.中国消费者了解茶叶资讯的渠道
5.中国消费者选购茶叶的渠道
6.中国消费者喝茶的主要场景和场所
7.中国消费者喜好的茶叶品类
8.中国消费者喜好的茶叶形态
9.中国消费者选购茶叶时的考虑因素
10.中国消费者单次购买茶叶的消费金额
五、中国茶叶行业企业竞争情报案例分析
1.中国茶叶行业企业竞争情报案例:茶里(企业概况)
2.中国茶叶行业企业竞争情报案例:茶里(产品矩阵)
3.中国茶叶行业企业竞争情报案例:茶里(礼盒系列)
4.中国茶叶行业企业竞争情报案例:茶里(供应链能力)
5.中国茶叶行业企业竞争情报案例:茶里(核心竞争力)
6.中国茶叶行业企业竞争情报案例:茶里(营销渠道)
7.中国茶叶行业企业竞争情报案例分析:大益茶(企业概况)
8.中国茶叶行业企业竞争情报案例分析:大益茶(旗下品牌)
9.中国茶叶行业企业竞争情报案例分析:大益茶(销售渠道)
10.中国茶叶行业企业竞争情报案例分析:大益茶(销售数据)
11.中国茶叶行业企业竞争情报案例分析:大益茶(舆情数据)
12.中国茶叶行业企业竞争情报案例分析:天福茗茶(企业概况)
13.中国茶叶行业企业竞争情报案例分析:天福茗茶(财务状况)
14.中国茶叶行业企业竞争情报案例分析:天福茗茶(主营业务)
15.中国茶叶行业企业竞争情报案例分析:天福茗茶(专利研发)
16.中国茶叶行业企业竞争情报案例分析:天福茗茶(舆情数据)
17.中国茶叶行业企业竞争情报案例分析:天福茗茶(面临风险)
18.中国茶叶行业企业竞争情报案例分析:中茶(企业概况)
19.中国茶叶行业企业竞争情报案例分析:中茶(旗下品牌)
20.中国茶叶行业企业竞争情报案例分析:中茶(财务状况)
21.中国茶叶行业企业竞争情报案例分析:中茶(舆情数据)
22.中国茶叶行业企业竞争情报案例分析:中茶(业务分布)
23.中国茶叶行业企业竞争情报案例分析:澜沧古茶(企业概况)
24.中国茶叶行业企业竞争情报案例分析:澜沧古茶(财务状况)
25.中国茶叶行业企业竞争情报案例分析:澜沧古茶(产品线一)
26.中国茶叶行业企业竞争情报案例分析:澜沧古茶(产品线二)
27.中国茶叶行业企业竞争情报案例分析:澜沧古茶(生产流程)
28.中国茶叶行业企业竞争情报案例分析:澜沧古茶(面临风险)
29.中国茶叶行业企业竞争情报案例分析:八马茶业(企业概况)
30.中国茶叶行业企业竞争情报案例分析:八马茶业(产品矩阵)
31.中国茶叶行业企业竞争情报案例分析:八马茶业(发展布局)
32.中国茶叶行业企业竞争情报案例分析:八马茶业(财务状况)
33.中国茶叶行业企业竞争情报案例分析:八马茶业(主营业务)
34.中国茶叶行业企业竞争情报案例分析:八马茶业(销售模式)
35.中国茶叶行业企业竞争情报案例分析:八马茶业(面临风险)
六、中国茶叶行业发展趋势分析
1.2022年中国茶叶行业发展趋势(一)
2.2022年中国茶叶行业发展趋势(二)
图表
图表1:2014-2021年中国社会消费品零售额和网络零售占社会总零售额占比
图表2:2003年Q1-2022年Q1中国茶叶生产价值指数(当期值)
图表3:2005年1月-2022年4月中国茶叶现货价格走势
图表4:2013年Q1-2022年Q1中国居民可支配收入情况
图表5:1990-2021年中国人口结构
图表6:2022年“茶叶”主题词云
图表7:“茶叶”网络口碑
图表8:2017-2027年中国茶叶行业市场规模及预测
图表9:2010-2021年中国茶叶产量及增长率
图表10:2021年中国茶园总面积
图表11:2021年中国茶园可采摘面积
图表12:2021年中国茶叶百强县TOP10
图表13:2022年河南省信阳县浉河区茶叶种植面积及产值
图表14:贵州湄潭县茶叶种植面积及产值
图表15:2022年福建武夷山市产茶情况
图表16:2021年中国干毛茶总产量
图表17:2019年中国各主要产茶省干毛茶产量
图表18:2021年中国主要产茶省份毛干茶产值TOP10
图表19:2021年中国干毛茶总产值
图表20:2020年中国六大茶类产量占比
图表21:2021年中国六大茶类产量占比
图表22:2019年1月-2022年4月中国精制茶加工工业生产出厂价格指数
图表23:2022年中国春茶采摘指数
图表24:2013-2021年中国茶叶内销总量及增幅
图表25:2021年不同茶叶种类销量占比
图表26:2018-2019年不同茶叶种类销量
图表27:2017-2023年中国茶叶线上市场规模及预测
图表28:2016-2021年中国茶叶进口量和进口额
图表29:2020H1-2021年中国茶类进口量对比
图表30:2021年中国进口茶叶前五国家
图表31:2001年1月-2021年9月中国茶叶月度出口数量
图表32:2021年中国不同茶叶种类出口数量占比
图表33:2021年中国茶叶主要出口国家/地区
图表34:2016-2021年全国国民人均可支配收入
图表35:2018-2024年中国礼物经济市场规模及预测
图表36:2017-2023年中国茶叶礼盒市场规模及预测
图表37:2022年中国茶叶消费者画像
图表38:2022年中国消费者喝茶频率
图表39:2022年中国消费者喝茶原因TOP4
图表40:2022年中国消费者茶叶资讯了解渠道TOP3
图表41:2022年中国消费者选购茶叶的渠道
图表42:2022年中国消费者喝茶的主要场景
图表43:2022年中国消费者喝茶的主要场所
图表44:2022年中国消费者自饮时偏好的茶叶品类
图表45:2022年中国消费者送礼时偏好的茶叶品类
图表46:2022年中国消费者偏好的茶叶形态
图表47:2022年中国消费者选购茶叶时的考虑因素
图表48:2022年中国消费者单次购买茶叶的消费金额
图表49:2022年中国消费者收到茶叶礼盒的情况
图表50:2022年中国消费者偏好的茶叶礼盒包装
图表51:2022年中国消费者对茶叶礼盒的满意度
图表52:2022年中国消费者关于茶叶礼盒可提升方向感知
图表53:2022年中国消费者对于网购茶叶的看法
图表54:2022年中国消费者购买茶叶时期待获得的服务
图表55:大益茶发展历程
图表56:大益集团旗下品牌
图表57:大益茶销售渠道分布
图表58:2015-2020年大益茶“双11”销售额
图表59:2021年天猫“双11”茶叶品牌销售额TOP10
图表60:2022年“大益茶”主题词云
图表61:2022年“大益茶”网络口碑
图表62:2017-2021年天福茗茶营收情况
图表63:2020-2021年天福茗茶主营业务构成
图表64:2012-2021年天福茗茶专利发布数量
图表65:截至2022年7月天福茗茶各项专利及著作类型分布
图表66:2022年天福茗茶地域消费指数分布
图表67:2022年天福茗茶网络口碑
图表68:中茶旗下品牌
图表69:2017-2020年H1中茶总收入及净利润
图表70:2022年“中茶”主题词云
图表71:2022年“中茶”网络口碑
图表72:2022年中茶主营业务区域构成
图表73:2019-2021年澜沧古茶总营收及毛利润
图表74:2019-2021年澜沧古茶净利润及净利率
图表75:1966产品线主要产品系列
图表76:1966产品线2021年营收情况
图表77:茶妈妈产品线主要产品系列
图表78:2019-2021年茶妈妈产品线营收情况
图表79:八马茶业发展布局
图表80:2019-2021年八马茶业营业收入及利润
图表81:2020-2021年八马茶业主营业务构成
图表82:2019-2021年八马茶业各类销售模式收入情况
图表83:2018-2021年八马茶业负面舆情事件
Comment:
Figure 1 :Share of retail sales of consumer goods and e-tailing in total social retail sales in China, 2014-2021
Figure 2 :2003Q1-2022Q1 China Tea Production Value Index (Current Value)
Figure 3 :The trend of spot price of Chinese tea from January 2005 to April 2022
Figure 4 :2013Q1-2022Q1 Disposable Income of Chinese Residents
Figure 5 :China's Population Structure from 1990 to 2021
Figure 6 :2022 \"Tea\" Subject Word Cloud
Figure 7 :“Tea” network word of mouth
Figure 8 :2017-2027 China tea industry market size and forecast
Figure 9 :China's tea production and growth rate from 2010 to 2021
Figure 10 :Total area of tea plantations in China in 2021
Figure 11 :Harvestable area of tea plantations in China in 2021
Figure 12 :TOP10 of Top 100 Tea Counties in China in 2021
Figure 13 :Tea planting area and output value in Shi he District, Xinyang County, Henan Province in 2022
Figure 14 :Tea planting area and output value in Mei tan County, Guizhou Province
Figure 15 :Tea production in Wuyishan City, Fujian in 2022
Figure 16 :China's total dry wool tea production in 2021
Figure 17 :Dry tea production in China's major tea producing provinces in 2019
Figure 18 :China's major tea-producing provinces dry wool tea output value TOP10 in 2021
Figure 19 :Total output value of dry wool tea in China in 2021
Figure 20 :Proportion of production of the six major tea categories in China in 2020
Figure 21 :Proportion of production of the six major tea categories in China in 2021
Figure 22 :Ex-factory price index of China's refined tea processing industry from Jan. 2019 to Apr. 2022
Figure 23 :2022 China Spring Tea Picking Index
Figure 24 :2013-2021 China's tea production and growth rate
Figure 25 :Proportion of different types of tea sales in 2021
Figure 26 :Sales of different types of tea in 2018 and 2019
Figure 27 :Scale of China's tea online market from 2017 to 2023
Figure 28 :China's tea import volume and import value, 2016-2021
Figure 29 :Comparison of China's Tea Imports in 2020H1-2021
Figure 30 :Top five countries importing tea in China in 2021
Figure 31 :Monthly Export Quantity of Tea in China, January 2001 - September 2021
Figure 32 :China‘s export volume share of different tea types in 2021
Figure 33 :The main export countries / regions of China's tea in 2021
Figure 34 :National per capita disposable income from 2016 to 2021
Figure 35 :Market scale and forecast of China's gift economy from 2018 to 2024
Figure 36 :China's tea gift box market scale and forecast from 2017 to 2023
Figure 37 :Consumer portrait of China tea industry in 2022
Figure 38 :Frequency of tea drinking by Chinese consumers in 2022
Figure 39 :TOP4 reason of Chinese consumer on drinking tea in 2022
Figure 40 :TOP 3 information channels about tea of Chinese consumer in 2022
Figure 41 :Ways of Chinese consumer on buying tea in 2022
Figure 42 :Scene of Chinese consumer on drinking tea in 2022
Figure 43 :Place of Chinese consumer on drinking tea in 2022
Figure 44 :Chinese consumers' preferred tea categories for self-consumption in 2022
Figure 45 :Tea categories preferred by Chinese consumers when giving gifts in 2022
Figure 46 :Tea forms preferred by Chinese consumers in 2022
Figure 47 :Factors Chinese consumers consider when shopping for tea in 2022
Figure 48 :Price per purchase of Chinese consumer on buying tea in 2022
Figure 49 :Chinese consumers receiving tea gift boxes in 2022
Figure 50 :Tea Gift Packaging Preferred by Chinese Consumers in 2022
Figure 51 :Tea Gift Packaging Preferred by Chinese Consumers in 2022
Figure 52 :Survey on Chinese consumers' perception of the promotion direction of tea gift boxes in 2022
Figure 53 :Attitude of Chinese consumer on buying tea by e-commerce channel in 2022
Figure 54 :Expected service of Chinese consumer on buying tea in 2022
Figure 55 :The development history of Da Yi Tea
Figure 56 :Dayi Group's brands
Figure 57 :Distribution of Dayi Tea Sales Channels
Figure 58 :2015-2020 Dayi Tea \"Double 11\" Sales
Figure 59 :2021 Tmall \"Double 11\" tea brand sales TOP 10
Figure 60 :“Dayi Tea” Theme Word Cloud,2022
Figure 61 :“Dayi Tea” network word of mouth
Figure 62 :Revenue of Tianfu Tea 2017-2021
Figure 63 :Revenue and growth rate of TenFu’s main business in 2020-2021
Figure 64 :Number of patents issued of TenFu in 2012-2021
Figure 65 :Distribution of patent types of TenFu as of July 2022
Figure 66 :Distribution of regional consumption index of TenFu in 2022
Figure 67 :Word of mouth of TenFu in 2022
Figure 68 :Brands under \"China Tea\"
Figure 69 :Sales revenue and net profit of China Tea in 2017-2020H1
Figure 70 :“China Tea” Theme Word Cloud,2022
Figure 71 :“China Tea” network word of mouth
Figure 72 :Distribution of regional consumption of China Tea in 2022
Figure 73 :Total Revenue and Gross Profit of Lancang Ancient Tea from 2019 to 2021
Figure 74 :Net Profit and Net Profit Margin of Lancang Ancient Tea from 2019 to 2021
Figure 75 :Main Produ ct Series of the 1966 Product Line
Figure 76 :Revenue of the 1966 Product Line in 2021
Figure 77 :Main Product Series of Tea Mother Product Line
Figure 78 :Revenue of Tea Mother Product Line in 2019-2021
Figure 79 :Bama Tea Development Layout
Figure 80 :2019-2021 Bama Tea Operating Revenue and Profit
Figure 81 :Revenue and growth rate of Bama Tea ’s main business in 2020-2021
Figure 82 :Bama Tea Revenue by Type of Sales Model 2019-2021
Figure 83 :Bama Tea negative public opinion events 2018-2021","groupId":0,"discount":"1.0","srcFile":"","iimediaUrl":"http://www.iimedia.cn/87099.html","readCount":6706,"reportType":0,"reportAuthor":"艾媒新零售产业研究中心","activityId":0,"isSubscribed":0,"activityTitle":"内含多人群、多年龄群体调研","price":11999.0,"id":43262,"isShowDownload":0,"reportLbImg":[],"publishTime":1658462168000,"visit_count":103688,"orgName":"","hasFile":1,"fileSize":9440428,"couponList":[],"shareUrl":"https://report.iimedia.cn/m-report.jsp?forWxShare=1&reportId=43262&sCode=BFAA231D87903BD9C1B0CDCADBCE4141&extT=","img":"https://img.iimedia.cn/00001320b3bbcd5918126e1a2276c9ec661c8b94f8715f2949d52386e6ede6484e434","groupType":0,"vipReportInfo":[{"id":62999,"raw":0,"payMode":1,"reportType":0,"pages":0,"equipType":0,"isOrderByIn":0,"toInfoPage":0,"offset":0,"count":10,"hasFile":0,"page":1,"isNewSearch":0,"title":"艾媒咨询 | 2025年中国电商“双十一”消费大数据监测报告","total":0,"op":0,"moduleType":3},{"id":57853,"raw":0,"payMode":1,"reportType":0,"pages":0,"equipType":0,"isOrderByIn":0,"toInfoPage":0,"offset":0,"count":10,"hasFile":0,"page":1,"isNewSearch":0,"title":"艾媒咨询 | 2025-2026年中国本地生活服务市场竞争格局和消费调查研究报告","total":0,"op":0,"moduleType":3},{"id":57852,"raw":0,"payMode":1,"reportType":0,"pages":0,"equipType":0,"isOrderByIn":0,"toInfoPage":0,"offset":0,"count":10,"hasFile":0,"page":1,"isNewSearch":0,"title":"艾媒咨询 | 2025年中国高考及院校录取分数大数据分析报告","total":0,"op":0,"moduleType":3},{"id":46744,"raw":0,"payMode":1,"reportType":0,"pages":0,"equipType":0,"isOrderByIn":0,"toInfoPage":0,"offset":0,"count":10,"hasFile":0,"page":1,"isNewSearch":0,"title":"艾媒咨询 | 2025年中国年份普洱茶行业现状及消费趋势洞察报告","total":0,"op":0,"moduleType":3},{"id":46687,"raw":0,"payMode":1,"reportType":0,"pages":0,"equipType":0,"isOrderByIn":0,"toInfoPage":0,"offset":0,"count":10,"hasFile":0,"page":1,"isNewSearch":0,"title":"艾媒咨询 | 2025年中国月子中心消费者行为调查数据","total":0,"op":0,"moduleType":3},{"id":46688,"raw":0,"payMode":1,"reportType":0,"pages":0,"equipType":0,"isOrderByIn":0,"toInfoPage":0,"offset":0,"count":10,"hasFile":0,"page":1,"isNewSearch":0,"title":"艾媒咨询 | 2025年中国预制鸡排消费行为调查数据","total":0,"op":0,"moduleType":3},{"id":46689,"raw":0,"payMode":1,"reportType":0,"pages":0,"equipType":0,"isOrderByIn":0,"toInfoPage":0,"offset":0,"count":10,"hasFile":0,"page":1,"isNewSearch":0,"title":"艾媒咨询 | 2025年中国服饰产品消费行为调查数据","total":0,"op":0,"moduleType":3},{"id":46690,"raw":0,"payMode":1,"reportType":0,"pages":0,"equipType":0,"isOrderByIn":0,"toInfoPage":0,"offset":0,"count":10,"hasFile":0,"page":1,"isNewSearch":0,"title":"艾媒咨询 | 2025年中国小程序电商用户消费行为调查数据","total":0,"op":0,"moduleType":3},{"id":46685,"raw":0,"payMode":1,"reportType":0,"pages":0,"equipType":0,"isOrderByIn":0,"toInfoPage":0,"offset":0,"count":10,"hasFile":0,"page":1,"isNewSearch":0,"title":"艾媒咨询 | 2025年中国第三方网络招聘平台使用行为调查数据","total":0,"op":0,"moduleType":3},{"id":46684,"raw":0,"payMode":1,"reportType":0,"pages":0,"equipType":0,"isOrderByIn":0,"toInfoPage":0,"offset":0,"count":10,"hasFile":0,"page":1,"isNewSearch":0,"title":"艾媒咨询 | 2025年中国化妆品消费者行为调查数据","total":0,"op":0,"moduleType":3}],"discountPrice":3699.0,"vipDiscountPrice":2219.4,"title":"艾媒咨询|2022-2023年中国茶叶产业发展及消费者洞察行业报告","reportGroupList":"","isDeleted":0,"typeList":[{"typeName":"行业研究报告","id":1}],"imContent":"
iiMedia Research(艾媒咨询)数据显示,2021年中国茶叶产量已达到318万吨,同比增长8.5%。在茶叶产量不断增加的同时,中国茶叶行业市场规模也保持连年增长态势,2021年市场规模达到2910.3亿元,预计2022年可达到3210亿元。根据调研数据,近五成中国消费者每天喝茶,喝茶保健养生观念深入人心。 中国消费者对于茶叶品质有着较高的要求,未来能够得到市场更多认可的,将会是在茶叶品质上反复打磨的茶叶厂商。此外,消费者的需求多样,未来的行业格局将会是多品牌共同发展的状态。因而品牌需要找准定位,并且在定位之中争取成为消费者的首选。(《艾媒咨询 | 2022-2023年中国茶叶产业发展及消费者洞察行业报告》完整高清PDF版共114页,可点击文章右侧浏览高清报告按钮进行报告浏览)
\r\nAccording to data from iiMedia Research, China's tea production has reached 3.18 million tons in 2021, an increase of 8.5% year-on-year. While tea production continues to increase, the market size of China's tea industry has also maintained a continuous growth trend, with the market size reaching 291.03 billion yuan in 2021 and expected to reach 321 billion yuan in 2022. According to the survey data, nearly 50% of Chinese consumers drink tea every day, and the concept of drinking tea health care is deeply rooted in the hearts of the people.
\r\nChinese consumers have higher requirements for tea quality, and the future can be more recognized by the market, which will be repeatedly polished by tea manufacturers in tea quality. In addition, the needs of consumers are diverse, and the future industry pattern will be a state of common development of multiple brands. Therefore, brands need to find the right positioning, and strive to become the first choice of consumers in the positioning.(“iiMedia Report | Research on China Tea Industry Development and Consumer Insights Report from 2022 to 2023” full version has 114 pages,please click the Browse HD Report button on the right side of the article to browse the report)
\r\n核心观点
\r\n市场规模:茶叶产量不断增加,线上市场规模持续扩张
\r\niiMedia Research(艾媒咨询)数据显示,2021年中国茶叶产量已达到318万吨,比2020年增长24.8万吨,同比增长8.5%。在茶叶产量不断增加的同时,中国茶叶行业市场规模也保持连年增长态势,增幅基本维持在8到11个百分点之间,2021年市场规模达到2910.3亿元,预计2022年可达到3210亿元。
\r\n市场洞察:近五成消费者每天喝茶,喝茶保健养生观念深入人心
\r\n调研数据显示,2022年超过九成的中国消费者有喝茶的经历,保持每天喝茶习惯的消费者占47.5%,茶叶成为人们生活中的刚需。随着健康养生观念的加深,63.3%受访消费者表示会选择喝茶来达到保健的目的。此外,喝茶场景多元化,兼具休闲、社交和商务等场景。
\r\n发展趋势:行业多品牌共同发展,提升茶叶品质是争夺消费者的关键
\r\n随着市场竞争的激化,茶品市场入局者开始探索行业品类细分化的市场需求,不断打造新场景、新产品、新需求,未来的行业格局将会是多品牌共同发展的状态。此外,中国消费者对于茶叶品质有着较高的要求,未来能够得到市场更多认可的,将会是在茶叶品质上反复打磨的茶叶厂商。
\r\n以下为报告内容节选:
\r\n中国茶叶分类介绍
\r\n中国茶叶行业发展经济背景分析(一)
\r\n数据显示,除2020年受疫情影响导致出现波动以外,2014至2021年中国社会消费品零售总额和网络零售占社会总零售额占比总体双双呈现上涨趋势。尽管2021年网络零售占比略有下降,但降幅甚微。在直播电商的火爆发展下,网上零售模式在疫情期间成为经济增长的重要抓手。这在一定程度上推动了茶企业数字化的程度,并加快和加深线上渠道的业务布局。
\r\n2017-2027年中国茶叶行业市场规模及预测
\r\n中国茶叶行业市场规模保持连年增长态势,增幅基本维持在8到11个百分点之间,2021年市场规模达到2910.3亿元,预计2022年可突破3000亿元,达到3210.0亿元。艾媒咨询分析师认为,我国是全球最大的产茶国和茶叶消费市场,茶叶行业未来将保持长期平稳向好发展的趋势。
\r\n2010-2021年中国茶叶产量数据分析
\r\n数据显示,2021年中国茶叶产量已达到318.0万吨,比2020年增长24.8万吨,同比增长8.5%。艾媒咨询分析师认为,茶叶与茶园种植面积关联性强,受到茶园面积增加影响,2021年茶叶生产的增长率较高。总体而言,茶叶生产情况相对稳定,保持持续增长状态。
\r\n2021年中国不同茶叶种类销量数据
\r\n数据显示,2021年中国六大茶类销量中,绿茶内销量130.92万吨,占总销量的56.9%;红茶内销33.88万吨,占总销量的14.9%;黑茶内销34.41万吨,占总销量的14.7%;乌龙茶内销22.79万吨,占总销量的9.9%;白茶内销7.05万吨,占总销量的3.1%;黄茶内销1.14万吨,占总销量的0.5%。相比2018年与2019年,2021年六大茶叶销量均实现了增长。
\r\n2017-2023年中国茶叶线上市场规模及预测
\r\n疫情期间,直播带货成为各行业进行营销的新模式,农产品也借助直播的东风开启线上营销模式,并取得较佳的成效。其中,茶企也在“直播热”的助力下不断加码线上营销,2021年中国茶叶的线上市场规模达到298亿元,同比增长12.5%,预计2023年可达358亿元。艾媒咨询分析师认为,未来,短视频、直播等线上营销将会成为茶企常态化的营销方式。
\r\n2017-2023年中国茶叶礼盒市场规模
\r\niiMedia Research(艾媒咨询)数据显示,2021年中国茶叶礼盒市场规模达到418.4亿元,2022年预计达到468.3亿元。市场规模从2017年的275.9亿元,到2020年的374.1亿元,年均保持了超过10%的增长。艾媒咨询分析师认为,礼物市场规模逐渐庞大,国人对茶叶礼盒的消费也将逐渐增长。
\r\n茶叶礼盒行业图谱
\r\n中国消费者喝茶频率
\r\n调研数据显示,2022年超过九成的中国消费者有喝茶的经历,保持每天喝茶习惯的消费者占47.5%,一周喝茶两三次的消费者占43.8%。艾媒咨询分析师认为,我国饮茶文化从古流传至今,在日常生活中广泛渗透,国人饮茶已成为一种普遍现象。加之当代人对于健康养生的需求不断上升,饮茶愉悦身心、滋养身体的益处让越来越多的消费者关注并选择饮茶。
\r\n中国消费者喝茶的主要原因
\r\n调查显示,63.3%的中国消费者表示喝茶的主要原因是保健养生,61.3%的消费者表示喝茶已成为一种生活习惯,而出于休闲放松和提神而喝茶的消费者分别占比59.0%和31.6%。艾媒咨询分析师认为,喝茶已经逐渐成为不少现代人生活中的一部分,除了用一种茶叶冲泡而成的传统茶饮之外,现在也流行着由茶叶混合其它原料制成的风味茶饮,不同原料发挥着不同的功效,受到了消费者的广泛欢迎。
\r\n中国消费者了解茶叶资讯的渠道
\r\n数据显示,2022年有51.3%的中国消费者通过网络信息的推送来了解茶叶相关资讯,此外还有部分消费者是通过主动搜索以及亲朋好友之间的传播来了解茶叶知识。艾媒咨询分析师认为,互联网的发展使得人们能较为轻易地在网络上找到不少茶叶的相关资料。并且,考虑到实际上每个人对于茶叶的需求和爱好都各有不同,亲朋好友之间对于不同茶叶的体验分享也更容易为人所接受。
\r\n中国消费者喜好的茶叶品类
\r\n调查显示,2022年中国消费者在自饮时最喜爱的茶叶是绿茶(50.7%)和红茶(50.5%),其次是普洱茶(45.4%),此外,花茶和白茶也获得了不少消费者的青睐。送礼时,中国消费者最偏好的茶叶则是普洱茶(64.2%),其次是红茶(40.1%)。艾媒咨询分析师认为,中国生产绿茶的产地极为广泛,价格较低,且常饮绿茶能防癌、降脂和减肥,故受到消费者偏爱。而普洱茶的品饮门槛相对较高,极具收藏和饮用价值,是送礼时的更优之选。
\r\n中国消费者选购茶叶时的考虑因素
\r\n调查显示,2022年中国消费者在选购自饮茶叶时最看重茶叶气味(66.5%),在选购送礼茶叶时最看重茶叶产地(62.7%)。相比之下,消费者对茶叶包装的注重程度则较低,在用于自饮和送礼时分别占比12.8%和29.9%。艾媒咨询分析师认为,消费者对茶叶品质越来越看重,而对茶叶品质的判断主要可从气味、产地中参见一二。此外,当前产品重包装轻质量的现象屡有出现,消费者对包装的考量程度有所降低。
\r\n中国消费者单次购买茶叶的消费金额
\r\n调研数据显示,为了自饮而购买茶叶的消费者会更注重茶叶的性价比,消费100-200元的消费者占比最高,为36.5%。而以送礼为目的消费者会购买价格更高的茶叶,37.5%的消费者选择了200-400元的茶叶,20.0%的消费者选择了400-600元的茶叶。艾媒咨询分析师认为,目前茶叶市场价格分化较为明显,散装茶叶价格较为大众化,礼盒装的茶叶更适合送礼,价格普遍较高。
\r\n中国消费者偏好的茶叶礼盒包装
\r\n调研数据显示,2022年中国消费者最喜爱金属包装的茶叶礼盒,占比43.3%,其次是纸盒包装,占比29.9%。艾媒咨询分析师认为,相比陶瓷包装的易碎特点,金属包装和纸盒包装的礼盒在保持美观的同时更坚稳牢固,可避免送礼时出现礼品破碎的尴尬场景。
\r\n中国消费者对于网购茶叶的看法
\r\n调研数据显示,2022年超七成中国消费者认为通过电商渠道购买茶叶时,存在卖家过多、鱼龙混杂,导致质量难辨的困扰;还有近五成消费者认为电商渠道没有实体店的选购体验感,服务不专业。但也有部分消费者认为网购茶叶种类齐全、产品丰富。艾媒咨询分析师认为,电商渠道无法直观看到要购买的产品品相,会给茶叶选购造成一定的困难。对消费者而言,通过电商渠道购买茶叶应选择品牌旗舰店或信誉度较高的店铺,在保证所购产品质量的同时也能获得较好的售后服务。
\r\n中国茶叶行业企业竞争情报案例:天福茗茶(主营业务)
\r\n天福集团的主要产品为茶叶、茶食品及茶具,并通过自有、第三方零售门市及专卖点的全国性网络出售这些产品。数据显示,2020年和2021年天福集团茶叶、茶具、茶食品的营业收入都达到总营收的九成以上。2021年茶叶营收为13.98亿元,占比为72.6%,同比2020年有所增加,茶食品和茶具营收分别为2.48亿元和1.98亿元,占比并未发生比较大的变化。
\r\n中国茶叶行业企业竞争情报案例:天福茗茶(面临风险)
\r\n风险一:消费增长动力转移
\r\n大众茶叶消费已成为主流,在茶行业转型发展中,其增长动力和发展机会已经逐渐从一二线城市转移到市场空白区域和发展空间更大的三四线城市。
\r\n天福茗茶需要加大下沉市场的开拓扶持力度,提供配套支持,进行区域化深耕,通过团购、客户订制、直播等方式搭建私域流量池,将品牌覆盖到更多三四线城市。
\r\n风险二:渠道渗透力有待提高
\r\n茶产品触达消费者的渠道越来越丰富多样,尤其在受到疫情影响后,茶叶消费者习惯于在线上接触产品、了解品牌。天福茗茶过去对于线下销售渠道的投入较大,而当前的消费习惯对天福产品的线上展示能力、线上销售渠道渗透力提出了更高的要求。
\r\n天福茗茶需对传统茶叶消费进行线上线下多场景融合,在运营上加强电商平台推广,在抖音、快手等平台建立宣传销售矩阵,在消费欲望层面实现更有效的覆盖,形成消费惯性。
\r\n中国茶叶行业企业竞争情报案例:中茶(财务状况)
\r\n近年中茶着手营销布局海内外茶叶市场,同步覆盖传统线下渠道、线上电商渠道。而随着茶叶市场的稳步扩张,中茶的产能及渠道也随之铺排,公司业务规模迅速增长。数据显示,中茶股份营业收入从2017年的12.3亿元增长至2019年的16.3亿元,复合增长率达到15.11%。2020年上半年中茶营收7.7亿元,净利润为0.8亿元,公司盈利能力较为稳定。艾媒咨询分析师认为,业务增长主要是因为茶叶市场扩张及中茶品牌“国饮中茶”受到市场认可,而该品牌接下来仍将是中茶战略发展聚焦点。
\r\n中国茶叶行业企业竞争情报案例:中茶(舆情数据)
\r\n数据显示,在2022年1月5日至7月5日的舆情监测区间内,中茶的主题词多与“印级”“六堡茶”“普洱茶”“紧压茶”等有关。中茶的网络口碑值为50.1,舆论评价偏正面。2018年,梧州六堡茶厂开始投产,先进生产技术带动着中茶的六堡茶茶叶品质提升,实现六堡茶量价齐升。中茶窖藏六堡茶传承了六堡茶的传统工艺“窖藏”,远销东南亚、日本、港澳台等地区,是海外闻名的侨销茶,网络口碑较好。
\r\n2022年中国茶叶行业发展趋势(一)
\r\n“直播热”助力茶叶销售,线上营销将成为常态化
\r\n疫情期间,直播带货成为各行业进行营销的新模式,农产品也借助直播的东风开启线上营销模式,并取得较佳的成效。其中,茶企也在“直播热”的助力下不断加码线上营销,2021年中国茶叶的线上市场规模达到298亿元。未来,短视频、直播等线上营销将会成为茶企常态化的营销方式。线上线下全渠道布局完备的成熟品牌将占据更大优势。
\r\n行业品类细分化,形成多品牌共同发展格局
\r\n随着市场竞争的激化,茶品市场入局者开始探索行业品类细分化的市场需求,不断打造新场景、新产品、新需求。当前传统茶行业已经进入了成熟阶段,庞大的市场规模和新兴的消费习惯让新晋茶企可以不断探索新的茶叶细分需求市场,形成自己的特色。此外,消费者的需求多样,未来的行业格局将会是多品牌共同发展的状态。因而品牌需要找准定位,并且在定位之中争取成为消费者的首选。
\r\n2022年中国茶叶行业发展趋势(二)
\r\n消费者对于茶叶品质有更高期待
\r\n调研数据显示,有61.4%的消费者希望提升茶叶礼盒的茶叶品质,而对于包装设计只有约33.7%的消费者期待改善。目前部分茶叶礼盒商家将重心放在包装外观上,忽略了茶叶的品质,中国茶文化影响广且深远,中国消费者对于茶叶品质有着较高的要求,未来能够得到市场更多认可的将会是在茶叶品质上反复打磨的茶叶厂商。
\r\n行业产品细分化,新品类不断涌现
\r\n为了创造新的消费点,茶叶及茶叶礼盒商家对产品的形态、原料、功能、消费场景等方向不断探索,产品品类的丰富程度也会增加,呈现出多元化发展趋势。同时,茶叶制作工艺的升级,也为茶叶形态、口感的发展提供着更多可能。
\r\n本文内容节选自艾媒咨询发布的《艾媒咨询|2022-2023年中国茶叶产业发展及消费者洞察行业报告》,完整版报告共114页,点击文末下方链接可直达完整版报告。
","chartNum":83,"categoryList":[{"id":134,"categoryName":"零售"}],"isShowOnLineReadUrl":"","summary":"iiMedia Research(艾媒咨询)数据显示,2021年中国茶叶产量已达到318万吨,同比增长8.5%。在茶叶产量不断增加的同时,中国茶叶行业市场规模也保持连年增长态势,2021年市场规模达到2910.3亿元,预计2022年可达到3210亿元。","shareUrlQrCode":"data:image/png;base64,iVBORw0KGgoAAAANSUhEUgAAAMgAAADICAYAAACtWK6eAAAE/UlEQVR42u3d0W7jMAwEwPz/T7fvBYqisEgu5VmgT75LHEdjgKKsfL5E5Nd8XAIRQEQAEQFEBBARQEQAEQFEBBARQEQEEBFARAARAUQEEBFARAARAeTnC30+rX9/vf/xC/XP83l6fk///dPr0f161eMDEEAAAQQQQAABBJD7gVQP0OkB//R8u28Q3eezfXwAAggggAACCCCAALIfyHQRfvr1n37e04C7i9pqwCmTNIAAAggggAACCCCAALKlSO8uOrsbi903FEAAAQQQQAABBBBAAEm/ANVF7ekivXsSIm0xKSCAAAIIIIAAAggggFQXlelF6/T5Vi9O7J60sFgREEAAAQQQQAABBJBqIOlFoOOzx+1qAojjgADiOCCAOA7I9ty+EV16IzZtsScggAACCCCAAAIIIPcDSVvMN70JQ0qRmXID0SgEBBBAAAEEEEAAAWQaSPWA7R7w1V9o9UZ03Te0tBsIIIAAAggggAACCCDv64NUD4j0SYjTAzqtkXj6hggIIIAAAggggAACCCDdjaruRlJ6Ubl9MWLaYlJAAAEEEEAAAQQQQPYV6dXHu4vwtE0H0kHc8kAVIIAAAggggAACCCD3AkkDNb35dDXg7us9/fqAAAIIIIAAAggggNwPJO0BqurG33QR2t3I3DZpAQgggAACCCCAAALI+4BUF/WnwXU30roHQPoPFKXcoAABBBBAAAEEEEAA2fMbhWlFYfUkQ/pGd6cHVGpRfXwcAwIIIIAAAggggAASCyR1sVkKwPT3Szs/QAABBBBAAAEEEEAASf8CuoFuX+y3rfH3+k46IIAAAggggAACCCDxAzAN9HRjs3rA2rQBEEAAAQQQQAABBJBuIKc/8HQjafoHZKav7/T/BwQQQAABBBBAAAEEkOmiuHoAp2/+3H2DSQM1tbgVEEAAAQQQQAABBJBcIN2NqdNf8PTnrZ406L7+W4pwQAABBBBAAAEEEED2AtlWxKdPGnQ3MtMai9WNVkAAAQQQQAABBBBA7gOy7Uc8uxuJ3UV3WtF/enytK9IBAQQQQAABBBBAACkHsg1U2gNf24ro6U0tAAEEEEAAAQQQQAB532LF6gEyDTTtB2m2f97p8QUIIIAAAggggAACyD4g1Y226iIyfVJi+np1T4JUnz8ggAACCCCAAAIIIO8D0n08rUitHlCnb2DVky6pm5kDAggggAACCCCAAJILJL3Inn6/6kmD9M2j7awICCCAAAIIIIAAAkg1kOkvvPv8b2u8df9VT/IAAggggAACCCCAAPI+INObRU8/4NRdZL5tEwlAAAEEEEAAAQQQQADpLiLTGk9pjczqovqWjeIAAQQQQAABBBBAANkDZDrTALuL8rTFl+kbAwICCCCAAAIIIIAAch+QtMVt05MA6ddvutE3NeABAQQQQAABBBBAALkXyHQR3l30Vp//9ANS3Z8PEEAAAQQQQAABBBBATjeSpou89M20nwJJe4AsHSgggAACCCCAAAIIIIBMv/50I7B6gHaDqZ6UAAQQQAABBBBAAAEEkG4gaY2/9E0K0je6AwQQQAABBBBAAAEEkKlGTVXj6/T5pz8QlN5YfH2RDggggAACCCCAAAJIeZGV1ug6/QWfBpm+SUL6A2eAAAIIIIAAAggggNwHROTGACICiAggIoCIACICiAggIoCIACICiIgAIgKICCAigIgAIgKICCAi1+QbE30LU5F0gCUAAAAASUVORK5CYII=","module_type":1,"memberPrice":3699.0,"introduce":"iiMedia Research(艾媒咨询)数据显示,2021年中国茶叶产量已达到318万吨,同比增长8.5%。在茶叶产量不断增加的同时,中国茶叶行业市场规模也保持连年增长态势,2021年市场规模达到2910.3亿元,预计2022年可达到3210亿元。","isPublished":1,"filePath":"20220722/【完整版】2022-2023年中国茶叶产业发展及消费者洞察行业报告.pdf","updateTime":1733305848000,"pageNum":114,"labelList":[{"id":7109,"labelName":"茶叶"},{"id":14243,"labelName":"茶叶产量"},{"id":23059,"labelName":"保健养生"},{"id":23060,"labelName":"茶叶行业"},{"id":10923,"labelName":"绿茶"},{"id":12487,"labelName":"黄茶"},{"id":10924,"labelName":"乌龙茶"},{"id":11813,"labelName":"黑茶"},{"id":4414,"labelName":"休闲"},{"id":10922,"labelName":"红茶"},{"id":275,"labelName":"社交"},{"id":12486,"labelName":"白茶"},{"id":23061,"labelName":"商务"},{"id":23062,"labelName":"茶叶分类"},{"id":23063,"labelName":"直播电商目录"}],"isShowOnLineRead":0,"seourl":"https://report.iimedia.cn/repo134-0/43262.html","showPrice":11999.0,"createTime":1658460701000,"freePages":10,"md5":"d49ecca847f15ce9004efc7819d94291"},"isInShopCart":0,"acList":[],"isCollectCategory":false,"isCollected":0,"isBought":0},"isStop":0,"name":"艾媒咨询|2022-2023年中国茶叶产业发展及消费者洞察行业报告"}, industryInfo={nodeStat=0, name=餐饮食品, is_end=0, pid=31026926, type=7, name_id=null, node_id=44278057, sort_id=3}, nodeInfo={name=艾媒咨询|2022-2023年中国茶叶产业发展及消费者洞察行业报告, isCollect=0, isSub=0, type=5, nodeId=44296497}}}}" />短信登录
中国+86
中国+86
一周内保持登录创建/忘记密码?
- {{ item.name }}

地址:
中国. 广州大学城
总机:
020-8922-4700
数据背书
用数据说话,为增长导航
范围:市场地位证明;联合白皮书;品宣报告;标杆案例;竞争情报;奖项参与等相关事项咨询
例如:大数据验证全球/全国销量(额)第一/领先;品类首创/开创者;第一品牌等市场地位确认服务;数据/报告的第三方背书用途(品宣方向)
180-2235-3365
艾媒智库
范围:会员购买;消费调查;商城报告;内参报告定制等相关事项咨询
例如:想了解商城报告/数据/会员的购买疑问;用户(消费)行为调查;定制内部决策用报告(内参方向)
020-8922-4416 或 181-0273-0697
加入社群
加入艾媒行业实名交流群,获取最新市场咨询、行业数据、合作资源;
目前已开通新科技、新消费及大文娱、大健康、新零售、未来教育、餐饮、快消等超10大领域产业链社群,欢迎业界人士加入。
媒体合作
艾媒分析师记者采访、媒体约稿;内容转载授权;媒体资源置换合作。
news@iimedia.cn
网站投稿
用于投稿、新闻线索收集、爆料及同类信息交互需求,为用户提供便捷的内容提交与反馈通道。
news@iimedia.cn
订阅邮件
50W+ 行业精英每周必读的行业数据报告
行业大类选择我们将会根据您的喜好为您定向推送内容。
邮箱我们将会根据您的喜好为您定向推送内容。
搜索热词:


{{ userDotCount > 99 ? '99+' : userDotCount }}
![]()
![]()
智库VIP
未开通开通会员,免费浏览海量数据
-
报告中心
-
我的收藏
-
我的发票
-
个人中心
{{ userDotCount > 99 ? '99+' : userDotCount }} -
金鹰计划
-
帮助中心


点击按相关度搜索
展示停更数据
 会员数据
会员数据
所属行业:餐饮食品


根据CC准则,此许可证向用户授予以下权利:署名来源;禁止修改;允许商业转载。Attribution-NoDerivatives
4.0国际公共许可证
更多信息
在线咨询
刷新图表
标题设置
字体大小
数值显示
刻度设置
图片属性
- 图表
- 列表
- 媒体图表
下载
PNG
XLS
PPT
显示数值
联合logo
图表展示:
全部时间
- 全部时间
- 最近一周
- 最近一月
- 最近半年
- 最近一年
- 最近三年
- 最近五年
图表展示:
图表展示:
(拖动上方滑块改变图表横轴范围)
去投融数据库看详细数据 >>
多年同列只支持月频或季频指标
| 时间 | 数据(亿元) |
|---|
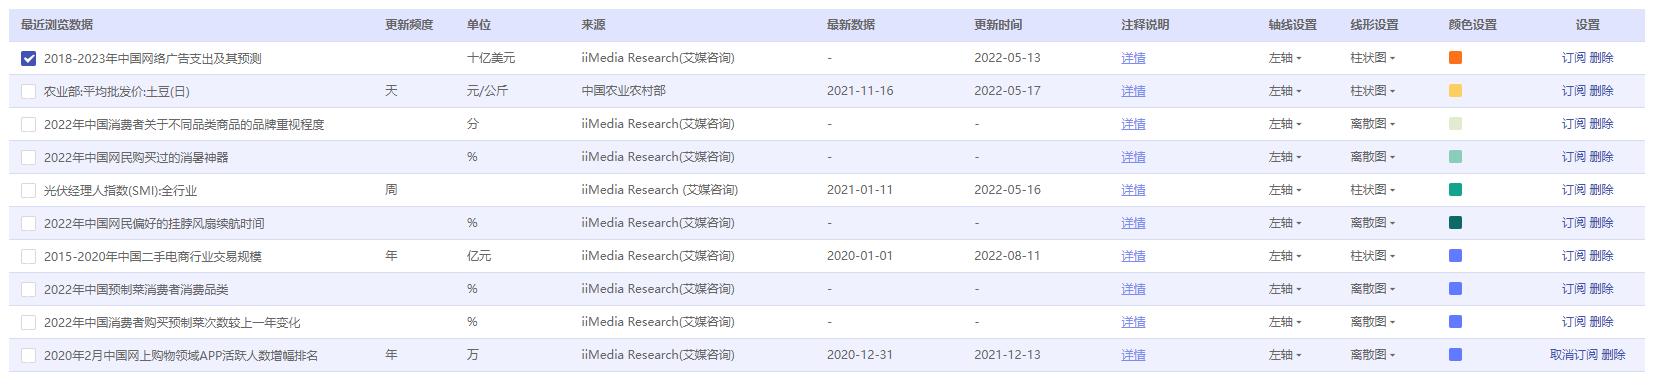
| 最近浏览数据 | 更新频度 | 单位 | 来源 | 最新数据 | 更新时间 | 注释说明 | 轴线设置 | 线形设置 | 颜色设置 | 设置 |
|---|
查看更多
其他相关数据