全球领先的新经济产业第三方数据挖掘与分析机构
1.中国酒类行业细分品类市场介绍
2.中国酒类行业发展历程及特点
3.中国酒类行业发展环境分析:经济环境
4.中国酒类行业发展环境分析:社会环境
5.中国酒类行业发展环境分析:技术环境
6.中国酒类行业发展环境分析:政策环境
7.中国酒行业商情监测(一)
8.中国酒行业商情监测(二)
9.中国酒行业商情监测(三)
10.中国酒行业商情监测(四)
11.中国酒行业商情监测(五)
二、中国酒行业市场发展现状概览
1.中国酒行业生产规模
2.中国酒类企业品牌价值200强地域分布
3.中国各类酒销售收入占比
4.中国酒类消费规模数据分析
5.中国新春白酒品牌10强榜单
6.中国双11啤酒品牌榜TOP10
7.中国双11葡萄酒品牌榜TOP10
8.中国酒类消费偏好及分析
9.中国酒类行业进口数据及分析
10.中国葡萄酒进口数据及分析
11.中国啤酒进口数据及分析
12.中国白酒进口数据及分析
13.中国白酒、啤酒出口数据及分析
14.中国白酒行业市场规模
15.中国酒类行业效益分析
16.中国酒类行业特点
三、中国三大酒类标杆企业商业运作案例研究
1.中国白酒行业龙头企业商业运作案例研究
(1)中国20家白酒企业市值对比
(2)中国20家白酒企业市值对比
(3)中国20家上市白酒企业梯队分布
(4)中国四大龙头白酒企业产品力对比
(5)中国四大龙头白酒企业经营情况对比
(6)中国四大龙头白酒企业偿债能力对比
(7)中国四大龙头白酒企业运营能力对比(一)
(8)中国四大龙头白酒企业运营能力对比(二)
(9)中国四大龙头白酒企业研发能力对比
(10)中国四大龙头白酒企业产销量对比
(11)中国三大龙头白酒企业高端酒销量对比
(12)中国四大龙头白酒企业营销模式对比
(13)中国四大龙头白酒企业渠道变革趋势
(14)中国龙头白酒企业市场布局策略分析
(15)中国龙头白酒企业产品价位对比
2.中国葡萄酒行业龙头企业商业运作案例研究
(1)中国10家葡萄酒上市企业营收排行
(2)中国10家葡萄酒上市企业利润排行
(3)中国葡萄酒行业典型企业分析一:张裕集团(一)
(4)中国葡萄酒行业典型企业分析一:张裕集团(二)
(5)中国葡萄酒行业典型企业分析一:张裕集团(三)
(6)中国葡萄酒行业典型企业分析二:通葡股份(一)
(7)中国葡萄酒行业典型企业分析二:通葡股份(二)
(8)中国葡萄酒行业典型企业分析二:通葡股份(三)
(9)中国葡萄酒行业典型企业分析二:通葡股份(四)
3.中国啤酒行业龙头企业商业运作案例研究
(1)中国啤酒行业龙头企业营收排名
(2)中国啤酒行业龙头企业分析一:青岛啤酒(一)
(3)中国啤酒行业龙头企业分析一:青岛啤酒(二)
(4)中国啤酒行业龙头企业分析一:青岛啤酒(三)
(5)中国啤酒行业龙头企业分析二:重庆啤酒(一)
(6)中国啤酒行业龙头企业分析二:重庆啤酒(二)
(7)中国啤酒行业龙头企业分析二:重庆啤酒(三)
(8)中国啤酒行业龙头企业分析二:重庆啤酒(四)
四、中国酒行业商业转型与模式创新研究
1.中国酒类行业发展趋势分析(一)
2.中国酒类行业发展趋势分析(二)
3.中国酒类行业发展趋势分析(三)
4.中国酒类行业发展趋势分析(四)
5.中国酒类行业发展趋势分析(五)
6.中国酒类行业发展趋势分析(六)
图表:
图表1 2013-2022年中国国内生产总值
图表22022年中国社会消费品零售总额
图表3“十四五”时期酒类流通健康发展的主要任务
图表42022年中国白酒、葡萄酒、啤酒产量与增速
图表52022年中国各省(直辖市)酒类企业200强数量
图表62022年中国酒类行业销售收入构成
图表72022年中国白酒、啤酒、葡萄酒销售收入与增速
图表82023年中国新春白酒品牌10强榜单
图表92023年中国消费者各类酒类偏好
图表102014-2022年中国酒类进口数量
图表112014-2022年中国酒类进口金额
图表122014-2022年中国葡萄酒进口量及进口金额
图表132014-2022年中国啤酒进口量及进口金额
图表142014-2022年中国白酒进口量
图表152018-2022年中国白酒和啤酒出口量及同比增速(单位:万千升)
图表162011-2027年中国白酒行业市场规模及预测
图表172022年中国各类酒行业利润总额
图表182022年白酒行业上市企业TOP4酒类对比
图表192022年白酒行业上市企业TOP4经营情况
图表202019-2022年白酒行业上市企业TOP4资产负债率对比(%)
图表212017-2022年白酒行业上市企业TOP4总资产周转率对比(次)
图表222017-2022年白酒行业上市企业TOP4存货周转率对比(次)
图表232018-2022年白酒行业上市企业TOP4研发费用对比(单位:亿元)
图表242019-2022年白酒行业上市企业TOP4酒类产销量对比
图表252019-2022年贵州茅台、五粮液、泸州老窖高端酒销量对比(单位:万吨)
图表262018-2022年各上市白酒企业提价分布
图表272021-2022年张裕集团营收情况
图表282022年张裕集团主营业务营收占比
图表29“张裕集团”网络口碑
图表30“张裕集团”主题词云
图表31张裕葡萄酒产品价格区间分布(部分)
图表322021-2022年通葡股份营收情况
图表332022年通葡股份主营业务营收占比
图表342022年通葡股份各产品收入占比
图表352022年通葡股份地区营收占比
图表36“通葡股份”网络口碑
图表37“通葡股份”主题词云
图表382022年中国啤酒龙头企业营收排名
图表392013-2022年青岛啤酒营收情况
图表40“青岛啤酒”网络口碑和网络热度指数
图表412014-2022年青岛啤酒吨位价格
图表42青岛啤酒产品结构
图表432022年重庆啤酒主营构成(按产品分类)
图表442022年重庆啤酒主营构成(按地区分类)
图表452009-2022年重庆啤酒营收情况
图表46“重庆啤酒”网络口碑和网络热度指数
图表472019-2022H1中国白酒销售收入CR5
图表482013年及2021年中国啤酒市占率CR5
图表492018-2022年中国酒类电商交易规模
图表502023年中国酒类消费者年龄分布
图表512018-2023年中国精酿啤酒市场规模及预测
图表522022年中国烈酒进口量及进口额
Figure1China's GDP from 2013-2022
Figure2China's Total retail sales of consumer goods in 2022
Figure3The main tasks for the healthy development of alcohol distribution during the \"14th Five-Year Plan\" period
Figure4China liquor, wine, beer production and growth rate in 2022
Figure5Number of Top 200 Liquor Enterprises in Various Provinces (Municipalities) of China in 2022
Figure6Composition ratio of sales revenue of various alcoholic beverages in China's brewing industry in 2022
Figure7Chinese liquor, wine, beer revenue and growth rate in 2022
Figure8TOP10 Chinese New Year spirits brand in 2023
Figure9Chinese consumers' preferences for various types of alcohol in 2023
Figure10China's wine imports from 2014-2022
Figure11China's import amount on liqueur from 2014-2022
Figure12 Import volume and import value of Chinese wind from 2014-2022
Figure13 Import volume and import value of Chinese beer from 2014-2022
Figure14 Import volume and import value of Chinese liquor from 2014-2022
Figure15 Export volume of Chinese liquor and beer in 2018-2022(10000 kiloliters)
Figure16Market scale and forecast of Chinese Baijiu industry from 2011 to 2027
Figure17Profit of various Chinese liqueur companies in 2022
Figure18Comparison of TOP4 liquors of listed companies in the liquor industry in 2022
Figure19TOP4 operating status of listed companies in the liquor industry in 2022
Figure20Comparison of TOP4 asset-liability ratio of listed companies in the liquor industry during 2019-2022(%)
Figure21Comparison of TOP4 total asset turn over of listed companies in the liquor industry during 2017-2022
Figure22Comparison of TOP4 Inventory turnover rate of listed companies in the liquor industry from 2017 to 2022
Figure23Comparison of TOP4 R & D expenses of listed companies in the liquor industry during 2018-2022(100 million RMB)
Figure24Comparison of alcohol production and sales of three companies listed from 2019 to 2022
Figure25Comparison of high-end wine sales in Maotai, Wuliangye, and Luzhou Laojiao from 2019 to 2022(10 thousand tons)
Figure26Price increase distribution of listed liquor companies during 2018-2022
Figure27Revenue of Changyu Group during 2021-2022
Figure28Proportion of main business revenue of Changyu Group in 2022
Figure29Price distribution of Changyu wine products
Figure30\"Changyu Group\" network word of mouth
Figure31\"Changyu Group\" keyword cloud
Figure32Tonghua Winery revenue during 2021-2022
Figure33Proportion of main business revenue of Tonghua Winery in 2022
Figure34Sales of various products and channels of Tonghua Winery in 2022
Figure35Proportion of regional revenue of Tonghua Winery revenue in 2022
Figure36“Tonghua Winery\" network word of mouth
Figure37\"Tonghua Winery\" keyword cloud
Figure38Revenue Ranking of China's Leading Beer Companies in 2022
Figure39Revenue of Tsingtao Brewery in 2013-2022
Figure40“Tsingtao Brewery\" network word of mouth and Network heat index
Figure412014-2022 Tsingtao beer tonnage price
Figure42Product structure of Tsingtao beer
Figure43Main business composition of Chongqing Beer in 2022(Classification by product)
Figure44Main business composition of Chongqing Beer in 2022(Classification by region)
Figure45Revenue of Chongqing Beer, 2009-2022
Figure46“Chongqing Beer \" network word of mouth and Network heat index
Figure47Sales revenue of Chinese Baijiu CR5 from 2019 to 2022H1
Figure48China's beer market share CR5 in 2013 and 2021
Figure492018-2022 China's wine E-commerce transaction scale
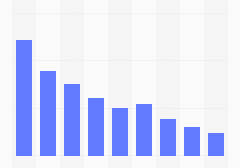
Figure50Age distribution of Chinese alcohol consumers in 2023
Figure51Market size and forecast of Chinese craft beer in 2018-2023
Figure52China's import volume and volume of spirits in 2022","groupId":0,"discount":"1.0","srcFile":"","iimediaUrl":"http://www.iimedia.cn/93080.html","readCount":6775,"reportType":0,"reportAuthor":"艾媒新零售产业研究中心","activityId":0,"isSubscribed":0,"activityTitle":"","price":2699.0,"id":43372,"isShowDownload":0,"reportLbImg":[],"publishTime":1683556057000,"visit_count":49168,"hasFile":1,"fileSize":11299949,"couponList":[],"shareUrl":"https://report.iimedia.cn/m-report.jsp?forWxShare=1&reportId=43372&sCode=BFAA231D87903BD9C1B0CDCADBCE4141&extT=","img":"https://img.iimedia.cn/10001a2ad76c0fddb05953e0191adbb76ab1fb67f67e9f33f4652f89da78db2f19b02","groupType":0,"vipReportInfo":[{"id":62999,"raw":0,"payMode":1,"reportType":0,"pages":0,"equipType":0,"isOrderByIn":0,"toInfoPage":0,"offset":0,"count":10,"hasFile":0,"page":1,"isNewSearch":0,"title":"艾媒咨询 | 2025年中国电商“双十一”消费大数据监测报告","total":0,"op":0,"moduleType":3},{"id":57853,"raw":0,"payMode":1,"reportType":0,"pages":0,"equipType":0,"isOrderByIn":0,"toInfoPage":0,"offset":0,"count":10,"hasFile":0,"page":1,"isNewSearch":0,"title":"艾媒咨询 | 2025-2026年中国本地生活服务市场竞争格局和消费调查研究报告","total":0,"op":0,"moduleType":3},{"id":57852,"raw":0,"payMode":1,"reportType":0,"pages":0,"equipType":0,"isOrderByIn":0,"toInfoPage":0,"offset":0,"count":10,"hasFile":0,"page":1,"isNewSearch":0,"title":"艾媒咨询 | 2025年中国高考及院校录取分数大数据分析报告","total":0,"op":0,"moduleType":3},{"id":46744,"raw":0,"payMode":1,"reportType":0,"pages":0,"equipType":0,"isOrderByIn":0,"toInfoPage":0,"offset":0,"count":10,"hasFile":0,"page":1,"isNewSearch":0,"title":"艾媒咨询 | 2025年中国年份普洱茶行业现状及消费趋势洞察报告","total":0,"op":0,"moduleType":3},{"id":46687,"raw":0,"payMode":1,"reportType":0,"pages":0,"equipType":0,"isOrderByIn":0,"toInfoPage":0,"offset":0,"count":10,"hasFile":0,"page":1,"isNewSearch":0,"title":"艾媒咨询 | 2025年中国月子中心消费者行为调查数据","total":0,"op":0,"moduleType":3},{"id":46688,"raw":0,"payMode":1,"reportType":0,"pages":0,"equipType":0,"isOrderByIn":0,"toInfoPage":0,"offset":0,"count":10,"hasFile":0,"page":1,"isNewSearch":0,"title":"艾媒咨询 | 2025年中国预制鸡排消费行为调查数据","total":0,"op":0,"moduleType":3},{"id":46689,"raw":0,"payMode":1,"reportType":0,"pages":0,"equipType":0,"isOrderByIn":0,"toInfoPage":0,"offset":0,"count":10,"hasFile":0,"page":1,"isNewSearch":0,"title":"艾媒咨询 | 2025年中国服饰产品消费行为调查数据","total":0,"op":0,"moduleType":3},{"id":46690,"raw":0,"payMode":1,"reportType":0,"pages":0,"equipType":0,"isOrderByIn":0,"toInfoPage":0,"offset":0,"count":10,"hasFile":0,"page":1,"isNewSearch":0,"title":"艾媒咨询 | 2025年中国小程序电商用户消费行为调查数据","total":0,"op":0,"moduleType":3},{"id":46685,"raw":0,"payMode":1,"reportType":0,"pages":0,"equipType":0,"isOrderByIn":0,"toInfoPage":0,"offset":0,"count":10,"hasFile":0,"page":1,"isNewSearch":0,"title":"艾媒咨询 | 2025年中国第三方网络招聘平台使用行为调查数据","total":0,"op":0,"moduleType":3},{"id":46684,"raw":0,"payMode":1,"reportType":0,"pages":0,"equipType":0,"isOrderByIn":0,"toInfoPage":0,"offset":0,"count":10,"hasFile":0,"page":1,"isNewSearch":0,"title":"艾媒咨询 | 2025年中国化妆品消费者行为调查数据","total":0,"op":0,"moduleType":3}],"discountPrice":2699.0,"vipDiscountPrice":1619.4,"title":"艾媒咨询 | 2023-2024年中国酒类行业发展状况与竞争态势分析报告","reportGroupList":"","shareContent":"","isDeleted":0,"typeList":[{"typeName":"行业研究报告","id":1}],"imContent":"
数据显示,2022年中国酿酒行业规模以上企业销售收入9508.98亿元,与上年同期相比增长9.11%。艾媒咨询分析师认为,随着国内疫情防控政策的全面放开,消费进入复苏期,2023—2024年中国整体酒类市场较2022年呈快速增长态势。中国白酒、啤酒行业销售收入CR5逐年攀升,行业集中度明显提高。目前整个酒类行业集中度不断加剧,当前消费者越发关注品牌和品质,在存量竞争的格局下,中小型酒企更应结合消费者需求做出核心产品,以应对市场竞争。(《艾媒咨询 | 2023-2024年中国酒类行业发展状况与竞争态势分析报告》完整高清PDF版共85页,可点击文章底部报告下载按钮进行报告下载)
\r\nData shows that in 2022, the sales revenue of enterprises above designated size in China's brewing industry reached 950.898 billion yuan, an increase of 9.11% compared to the same period last year. Analysts from iMedia Consulting believe that with the comprehensive relaxation of domestic epidemic prevention and control policies, consumption has entered a recovery period, and the overall alcohol market in China has shown a rapid growth trend from 2023 to 2024 compared to 2022. The sales revenue CR5 of Chinese Baijiu and beer industries has increased year by year, and the industry concentration ratio has significantly increased. At present, the concentration ratio of the entire liquor industry is increasing, and consumers are paying more attention to brand and quality. Under the pattern of stock competition, small and medium-sized liquor enterprises should make core products based on consumer demand to cope with market competition.(“iiMedia Report | 2023-2024 China Liquor Industry Development Status and Benchmark Case Analysis Report”full version has 85 pages,please click the download button at the bottom of the article to download the report)
\r\n核心观点
\r\n中国酒类生产体量下降,酒类市场消费进入复苏期
\r\n数据显示,2022年中国规模以上企业白酒(折65度,商品量)产量671.2万千升,同比下降5.6%;啤酒产量3568.7万千升,同比增长1.1%;葡萄酒产量21.4万千升,同比下降21.9%。2022年中国酿酒行业规模以上企业销售收入9508.98亿元,与上年同期相比增长9.11%。艾媒咨询分析师认为,随着国内疫情防控政策的全面放开,消费进入复苏期,2023—2024年中国整体酒类市场较2022年呈快速增长态势。
\r\n中国酒类消费主体逐步年轻化,推动酒类市场新变革
\r\niiMedia Research(艾媒咨询)调研数据显示,2023年中国酒类消费者年龄在31-40岁的比例最高,达49.78%;其次是18-30岁(39.13%)的消费群体,消费主体呈现出年轻化的趋势。艾媒咨询分析师认为,年轻消费主体的消费观和价值观呈现出个性化和多元化色彩,这种消费代际的新特点将促使酒类行业在品牌塑造、产品塑造、价值观塑造、营销模式和创新推广等方面迎合80、90后消费者进行变革。
\r\n中国酒类行业集中度提高,中小型酒企应结合市场竞争做出核心产品
\r\n中国白酒、啤酒行业销售收入CR5逐年攀升,行业集中度明显提高。艾媒咨询分析师认为,目前整个酒类行业集中度不断加剧,当前消费者越发关注品牌和品质,在存量竞争的格局下,中小型酒企更应结合消费者需求做出核心产品,以应对市场竞争。
\r\n以下为报告内容节选:
\r\n中国酒行业生产规模
\r\n数据显示,2022年中国规模以上企业白酒(折65度,商品量)产量671.2万千升,同比下降5.6%;啤酒产量3568.7万千升,同比增长1.1%;葡萄酒产量21.4万千升,同比下降21.9%。艾媒咨询分析师认为,2022年在疫情往复与经济环境下行的双重压力之下,整个酒类大行情均受影响,包括白酒、葡萄酒等在内的酒类行业均出现下滑态势。随着国内市场全面放开,消费进入复苏期,2023—2024年中国整体酒类市场较2022年呈快速发展态势。
\r\n中国酒类企业品牌价值200强地域分布
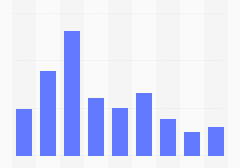
\r\n数据显示,2022年的中国酒类品牌价值200强中,贵州省企业数最多,有34家上榜。山东、北京、四川、广东上榜企业数量10家及以上。艾媒咨询分析师认为,近几年酱香型白酒市场火热,贵州省茅台镇为酱香型白酒的主要产区,酱酒热助力贵州成为酒类品牌价值第一大省。
\r\n中国酒类消费偏好及分析
\r\niiMedia Research(艾媒咨询)调研数据显示,2023年中国酒类消费者偏好啤酒、葡萄酒、白酒、洋酒的比例分别为:73.68%、67.57%、59.17%、33.43%。艾媒咨询分析师认为,啤酒、葡萄酒、白酒、洋酒作为我国的四大酒类,行业企业可以根据消费场景及消费人群来优化产品结构。
\r\n中国白酒行业市场规模
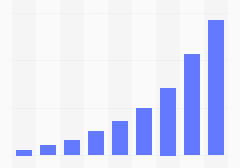
\r\n白酒行业加速推进供给侧结构性改革,随着去产能和调结构的逐步深化,行业总体呈现产出规模稳中有降、产出效益逐步提升的新特征。2022年1-12月,中国白酒行业规模以上企业累计完成产品销售收入达到6626.5亿元,累计增长9.6%。累计实现利润总额2201.7亿元,累计增长29.4%。预计2026年,中国白酒市场规模有望首次突破万亿大关。
\r\n中国酒类行业效益分析
\r\n2022年中国酿酒行业规模以上企业累计实现利润总额2491.48亿元,与上年同期相比增长27.38%。其中,全国规上白酒企业累计实现利润总额2201.72亿元,同比增长29.36%;规上葡萄酒企业累计实现利润总额2.78亿元,同比下降14.98%。仅白酒板块利润总额就占了酿酒行业总利润的88.37%。
\r\n中国四大龙头白酒企业产销量对比
\r\n从产销情况来看,2019-2022年期间山西汾酒销量提升幅度较大,为12.06%,贵州茅台销量增长1.82%,五粮液销量下降8.38%,泸州老窖-15.47%垫底。艾媒咨询分析师认为,由于泸州老窖聚焦高端、收缩中低端,低档酒的销售颓势直接影响了泸州老窖的整体销量。
\r\n中国四大龙头白酒企业营销模式对比
\r\n中国四大龙头白酒企业渠道变革趋势
\r\n中国葡萄酒行业典型企业分析一:张裕集团
\r\n2022年,张裕在葡萄酒领域持续进行升级举措,推动产品结构向中高端、特别是向高端聚焦。艾媒咨询分析师认为,未来,张裕会持续集中资源聚焦中高端品牌,通过中高端产品带动张裕的增长。随着年轻消费群体的崛起,张裕也推出新产品迎合该部分消费人群,进行渠道下沉。
\r\n中国葡萄酒行业典型企业分析二:通葡股份
\r\n数据显示,2022年通葡股份的白酒业务基本成为其营收大头,葡萄酒营收占比仅11.09%。从地区分布来看,除电商平台以外,通葡股份国内销售集中在东北地区,占比为4.65%。艾媒咨询分析师认为,通葡股份电商平台的品类仍是以白酒为主,葡萄酒的销路并没有打开,而且通葡股份主要市场集中在东北,对大本营以外的市场开拓不足。
\r\n中国啤酒行业龙头企业分析一:青岛啤酒
\r\n数据显示,近年来青岛啤酒吨位价格持续上升,2022年青岛啤酒吨位价为3985.6元。艾媒咨询分析师认为,由于中国啤酒市场消费需求日益多样化与个性化,青岛啤酒正在进行一系列中高端转型升级,青岛啤酒产品结构优化升级的策略清晰。
\r\n2023-2024年中国酒类行业发展状况与消费需求趋势分析简要概括(详细趋势分析请查阅完整版报告)
\r\n随着中国酒水行业发展愈加成熟,行业企业将继续加快产业结构调整和产品升级调整步伐,围绕“去产能+高端化” 转型。酒水市场竞争也由拼市场时代进入精耕利润时代,稳固大众市场,深耕中高端市场,优化产能,品质至上和价值回归将成为未来酒水企业发展的主要方向。
\r\n本文内容节选自艾媒咨询发布的《艾媒咨询|2023-2024年中国酒类行业发展状况与竞争态势分析报告》,完整版报告共85页,点击文末下方链接可直达完整版报告。
","chartNum":52,"categoryList":[{"id":7,"categoryName":"新零售"}],"isShowOnLineReadUrl":"","summary":"随着中国酒水行业发展愈加成熟,行业企业将继续加快产业结构调整和产品升级调整步伐,围绕“去产能+高端化” 转型。酒水市场竞争也由拼市场时代进入精耕利润时代,稳固大众市场,深耕中高端市场,优化产能,品质至上和价值回归将成为未来酒水企业发展的主要方向。","shareUrlQrCode":"data:image/png;base64,iVBORw0KGgoAAAANSUhEUgAAAMgAAADICAYAAACtWK6eAAAFBklEQVR42u3d0W7cMAwEwPv/n27fAxRFcCK5lGaBPqXxObbmAEo29fkjIv/MxyUQAUQEEBFARAARAUQEEBFARAARAUREABEBRAQQEUBEABEBRAQQEUB+Hujzaf337flM//5vj1d9fmnXo3p8AAIIIIAAAggggAByH5DjxdJ/jt99A357g05fn28/L+18UscfIIAAAggggAACCCB7gVQPsNPHrx5A3UV/dxGfNj4AAQQQQAABBBBAAAGk+wanL2ydBty9UAoIIIAAAggggAACCCCK9N4isxpc9/Gmfw4IIIAAAggggAACCCCnF5amAaYdb3ohLm2hMmX8AQIIIIAAAggggACiacOWItPPs8YHIH4OCCAGGCCAAALIfUCmc3ohr/oGpy1cni7qrxlXgAACCCCAAAIIIIDEAtn+AlT1AKl+Iar7flRP4qSABQQQQAABBBBAAAHk3iK9G0w3wLQmC9X3oxrgcwuFgAACCCCAAAIIIIC0X6Dp5tK3b7rZ/XBg6sOJgAACCCCAAAIIIIDcs1DY/bDbdJFbPSC2NXFIf3gTEEAAAQQQQAABBJD7gHRf4OnGbN0D9vZJgy4QgAACCCCAAAIIIIB4YWoKaPeAmgbSPUBTAAACCCCAAAIIIIAAci+QtCL+9ACebrbdPWkxDe657u6AAAIIIIAAAggggIwXZdsf3queNEjbNLS7yAcEEEAAAQQQQAAB5D0g082fuwdw9/Gnv9DS7zcggAACCCCAAAIIIO8BmU7aw5Lpn5d2fimN5AABBBBAAAEEEEAA2bs/yLdF3XQR3n09UovWrvGRMokBCCCAAAIIIIAAAoj3QbYWraf/nvQBnTaJAggggAACCCCAAALIe0DSBvj2SYXu67vtYU9AAAEEEEAAAQQQQN4Dkl7kpr3Adfp6TjeeSyv6AQEEEEAAAQQQQAC5D0j6JpfbB2RaE4XpZt/rN/EEBBBAAAEEEEAAASSuaO5uHt1dZN92Paq/cAABBBBAAAEEEEAAAWR6Ya57E8v0phHpv5/y8CEggAACCCCAAAIIIPcCmV54rJ5kqF443F5ET0/6AAIIIIAAAggggADyHpDupga3bRjTPSky/YJZ9/0HBBBAAAEEEEAAAeQ9INVF+vYXfNIX+qonCVKajQMCCCCAAAIIIIAAsrdxXHfz4vQitfrvm26CsG3DIkAAAQQQQAABBBBA7geyrUhN+/9pA3BbUQ8IIIAAAggggAACyH4g043Uti+spS9MTm8YdN3DioAAAggggAACCCCAzC/IhG36WX286YXU9EmB6xrHAQIIIIAAAggggADSXqRPX7DpDXSmJwmmm2hsW/gEBBBAAAEEEEAAAeT+Iv000LRm2ukLod0Lk6cnCa5fKAQEEEAAAQQQQAABJK6I27ahS3URXQ24+/Ovm8UCBBBAAAEEEEAAAaS8iO0+/vQGM9MPB6ZtENT9BQsIIIAAAggggAACCCDTm1xuW9jsnnSYbkKR9oUACCCAAAIIIIAAAgggaQtN3UVr2qTH9PW6/o1CQAABBBBAAAEEEEDWFemnz3f6+kyf/+nPn15YBQQQQAABBBBAAAHEw4rdAzp9UiGtmXV3Ef9ckQ4IIIAAAggggAACSPlCUPoNTxsw000oTp9falEOCCCAAAIIIIAAAoj9QUQmA4gIICKAiAAiAogIICKAiAAiAogIICICiAggIoCIACICiAggIoCIXJO/UWmHD/3IL1wAAAAASUVORK5CYII=","module_type":1,"memberPrice":2699.0,"introduce":"随着中国酒水行业发展愈加成熟,行业企业将继续加快产业结构调整和产品升级调整步伐,围绕“去产能+高端化” 转型。酒水市场竞争也由拼市场时代进入精耕利润时代,稳固大众市场,深耕中高端市场,优化产能,品质至上和价值回归将成为未来酒水企业发展的主要方向。","isPublished":1,"filePath":"20230509/【完整版】2023-2024年中国酒类行业发展状况与竞争态势分析报告.pdf","updateTime":1733305848000,"pageNum":85,"labelList":[{"id":6466,"labelName":"酒类"},{"id":453,"labelName":"消费"},{"id":37359,"labelName":"竞争态势"},{"id":4455,"labelName":"白酒"},{"id":5425,"labelName":"啤酒"},{"id":479,"labelName":"品牌"},{"id":4346,"labelName":"品质"},{"id":1436,"labelName":"消费者"},{"id":464,"labelName":"电商"},{"id":332,"labelName":"平台"},{"id":37360,"labelName":"中小型"},{"id":37077,"labelName":"渠道"},{"id":23368,"labelName":"酒企"},{"id":37315,"labelName":"需求"},{"id":4531,"labelName":"葡萄酒"},{"id":407,"labelName":"市场"},{"id":22608,"labelName":"中高端"}],"isShowOnLineRead":0,"seourl":"https://report.iimedia.cn/repo7-0/43372.html","shareTitle":"","showPrice":2699.0,"createTime":1683545093000,"freePages":10,"md5":"ec6056483919a98f923fa1ca45747490"},"isInShopCart":0,"acList":[],"isCollectCategory":false,"isCollected":0,"isBought":0},"isStop":0,"name":"艾媒咨询 | 2023-2024年中国酒类行业发展状况与竞争态势分析报告"}, industryInfo={nodeStat=0, name=餐饮食品, is_end=0, pid=31026926, type=7, name_id=null, node_id=44278057, sort_id=3}, nodeInfo={name=艾媒咨询 | 2023-2024年中国酒类行业发展状况与竞争态势分析报告, isCollect=0, isSub=0, type=5, nodeId=49160608}}}}" />短信登录
中国+86
中国+86
一周内保持登录创建/忘记密码?
- {{ item.name }}

地址:
中国. 广州大学城
总机:
020-8922-4700
数据背书
用数据说话,为增长导航
范围:市场地位证明;联合白皮书;品宣报告;标杆案例;竞争情报;奖项参与等相关事项咨询
例如:大数据验证全球/全国销量(额)第一/领先;品类首创/开创者;第一品牌等市场地位确认服务;数据/报告的第三方背书用途(品宣方向)
180-2235-3365
艾媒智库
范围:会员购买;消费调查;商城报告;内参报告定制等相关事项咨询
例如:想了解商城报告/数据/会员的购买疑问;用户(消费)行为调查;定制内部决策用报告(内参方向)
020-8922-4416 或 181-0273-0697
加入社群
加入艾媒行业实名交流群,获取最新市场咨询、行业数据、合作资源;
目前已开通新科技、新消费及大文娱、大健康、新零售、未来教育、餐饮、快消等超10大领域产业链社群,欢迎业界人士加入。
媒体合作
艾媒分析师记者采访、媒体约稿;内容转载授权;媒体资源置换合作。
news@iimedia.cn
网站投稿
用于投稿、新闻线索收集、爆料及同类信息交互需求,为用户提供便捷的内容提交与反馈通道。
news@iimedia.cn
订阅邮件
50W+ 行业精英每周必读的行业数据报告
行业大类选择我们将会根据您的喜好为您定向推送内容。
邮箱我们将会根据您的喜好为您定向推送内容。
搜索热词:


{{ userDotCount > 99 ? '99+' : userDotCount }}
![]()
![]()
智库VIP
未开通开通会员,免费浏览海量数据
-
报告中心
-
我的收藏
-
我的发票
-
个人中心
{{ userDotCount > 99 ? '99+' : userDotCount }} -
金鹰计划
-
帮助中心


点击按相关度搜索
展示停更数据
 会员数据
会员数据
所属行业:餐饮食品


根据CC准则,此许可证向用户授予以下权利:署名来源;禁止修改;允许商业转载。Attribution-NoDerivatives
4.0国际公共许可证
更多信息
在线咨询
刷新图表
标题设置
字体大小
数值显示
刻度设置
图片属性
- 图表
- 列表
- 媒体图表
下载
PNG
XLS
PPT
显示数值
联合logo
图表展示:
全部时间
- 全部时间
- 最近一周
- 最近一月
- 最近半年
- 最近一年
- 最近三年
- 最近五年
图表展示:
图表展示:
(拖动上方滑块改变图表横轴范围)
去投融数据库看详细数据 >>
多年同列只支持月频或季频指标
| 时间 | 数据(亿元) |
|---|
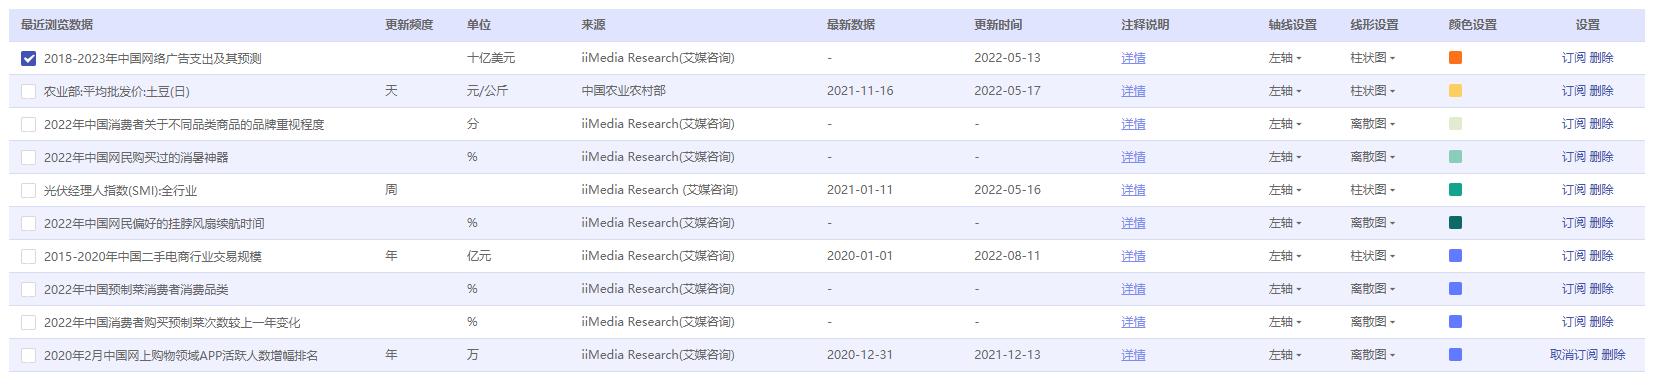
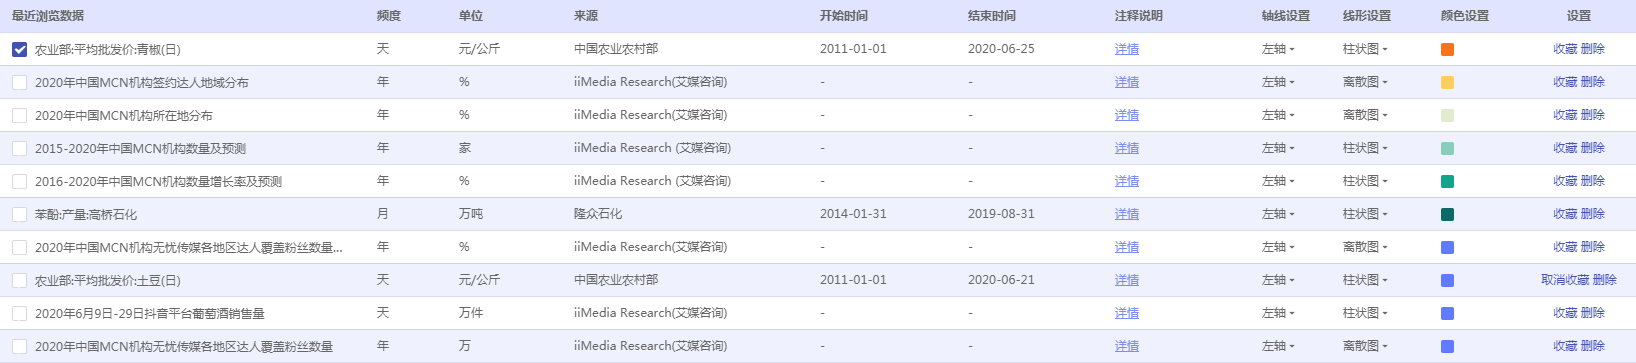
| 最近浏览数据 | 更新频度 | 单位 | 来源 | 最新数据 | 更新时间 | 注释说明 | 轴线设置 | 线形设置 | 颜色设置 | 设置 |
|---|
查看更多
其他相关数据