全球领先的新经济产业第三方数据挖掘与分析机构
预制菜行业定义及术语
预制菜行业分类
预制菜行业发展历程
二.中国预制菜行业发展环境分析
中国预制菜行业政策环境分析:国家政策
中国预制菜行业政策环境分析:地方政策(一)
中国预制菜行业政策环境分析:地方政策(二)
中国预制菜行业政策环境分析:行业组织
中国预制菜行业政策环境分析:行业标准(一)
中国预制菜行业政策环境分析:行业标准(二)
中国预制菜行业经济环境分析:居民消费水平
中国预制菜行业经济环境分析:餐饮业收入
中国预制菜行业社会环境分析:城镇化率
中国预制菜行业社会环境分析:家庭结构变化
中国预制菜行业社会环境分析:做饭意愿变化
中国预制菜行业社会环境分析:降本增效需求
中国预制菜行业技术环境分析:关键加工技术
中国预制菜行业技术环境分析:加工技术创新情况
中国预制菜行业技术环境分析:烹饪加工技术
中国预制菜行业技术环境分析:冷链物流技术
三.中国预制菜行业产业链分析
中国预制菜产业链图谱
中国预制菜产业链概况
中国预制菜产业链龙头企业梳理
中国预制菜产业链上游分析:粮食及蔬菜
中国预制菜产业链上游分析:肉类及水产总量
中国预制菜产业链上游分析:海水、淡水产品产量
中国预制菜产业链上游分析:鱼类产量
中国预制菜产业链上游分析:虾类产量
中国预制菜产业链上游分析:小龙虾产量
中国预制菜产业链上游分析:蟹类产量
中国预制菜产业链上游分析:贝类产量
中国与预制菜产业链上游分析:猪、牛、羊存栏量
中国预制菜产业链中游分析:传统预制菜企业模式
中国预制菜产业链中游分析:速冻食品企业模式
中国预制菜产业链中游分析:餐饮企业模式
中国预制菜产业链中游分析:零售企业模式
中国预制菜产业链中游分析:预制菜企业概况(一)
中国预制菜产业链中游分析:预制菜企业概况(二)
中国预制菜产业链中游分析:预制菜区域典型企业
中国预制菜产业链中游分析:预制菜百强企业评价
中国预制菜产业链中游分析:预制菜百强企业名单(一)
中国预制菜产业链中游分析:预制菜百强企业名单(二)
中国预制菜产业链中游分析:预制菜百强企业名单(三)
中国预制菜产业链中游分析:预制菜百强企业名单(四)
中国预制菜产业链中游分析:预制菜百强企业名单(五)
四.中国预制菜市场发展现状
全球预制菜行业发展历程及主要国家发展概况
国外典型预制菜企业案例分析
中国预制菜市场规模发展空间
中国预制菜细分市场分析:肉禽预制菜
中国预制菜细分市场分析:水产预制菜
中国预制菜细分市场分析:米面/蔬菜类预制菜
中国预制菜重点企业生产模式及产销量情况
中国电商平台预制菜销量数据监测分析
中国电商平台预制菜热销数据情况:品牌
中国电商平台预制菜热销数据情况:店铺
中国电商平台预制菜热销数据情况:商品
中国预制菜爆款单品研究分析:酸菜鱼(一)
中国预制菜爆款单品研究分析:酸菜鱼(二)
中国预制菜爆款单品研究分析:虾滑(一)
中国预制菜爆款单品研究分析:虾滑(二)
中国预制菜行业投融资市场概况
中国预制菜销售渠道发展分析:B端及C端情况
中国预制菜行业典型营销案例:年鱼经济(一)
中国预制菜行业典型营销案例:年鱼经济(二)
五.中国预制菜B端重点市场发展概况
中国预制菜行业B端细分渠道
中国预制菜B端重点市场:外卖行业(一)
中国预制菜B端重点市场:外卖行业(二)
中国预制菜B端重点市场:外卖行业(三)
中国预制菜B端重点市场:连锁餐饮行业(一)
中国预制菜B端重点市场:连锁餐饮行业(二)
中国预制菜B端重点市场:连锁餐饮行业(三)
中国预制菜B端重点市场:连锁餐饮行业(四)
中国预制菜B端重点市场:连锁餐饮行业(五)
中国预制菜B端重点市场:连锁餐饮行业(六)
中国预制菜B端重点市场:连锁餐饮行业(七)
中国预制菜B端重点市场:连锁餐饮行业(八)
中国预制菜B端重点市场:团餐行业发展历程
中国预制菜B端重点市场:团餐行业服务模式
中国预制菜B端重点市场:团餐行业运营模式
中国预制菜B端重点市场:团餐行业结构划分
中国预制菜B端重点市场:团餐行业发展特点
中国预制菜B端重点市场:团餐行业市场规模
中国预制菜B端重点市场:团餐企业供应商数量
中国预制菜B端重点市场:团餐行业客户划分
中国预制菜B端重点市场:酒店行业(一)
中国预制菜B端重点市场:酒店行业(二)
中国预制菜B端重点市场:酒店行业(三)
中国预制菜B端重点市场:酒店行业(四)
中国预制菜B端重点市场:酒店行业(五)
六.中国预制菜C端消费者洞察
中国预制菜消费者画像分析
中国预制菜消费者购买频次及品类
中国预制菜消费者购买品类分析:水产预制菜
中国消费者水产预制菜购买金额及价格接受度
中国预制菜消费者购买品类分析:畜禽预制菜
中国消费者畜禽类预制菜购买渠道及消费场景
中国预制菜消费者购买品类分析:小吃糕点类(一)
中国预制菜消费者购买品牌分析:小吃糕点类(二)
中国预制菜消费者洞察分析:菜系偏好
中国预制菜消费者洞察分析:购买原因
中国预制菜消费者洞察分析:考虑因素
中国预制菜消费者洞察分析:购买顾虑
中国预制菜消费者洞察分析:期待改进方向
中国预制菜消费者洞察分析:行业前景认可度
七.中国预制菜行业省份发展水平研究
中国预制菜行业省份发展指数评价模型说明
中国各省预制菜产业发展水平排行榜
中国预制菜行业省份发展竞争力分析:广东(一)
中国预制菜行业省份发展竞争力分析:广东(二)
中国预制菜行业省份发展竞争力分析:广东(三)
中国预制菜行业省份发展竞争力分析:广东(四)
中国预制菜行业省份发展竞争力分析:广东(五)
中国预制菜行业省份发展竞争力分析:广东(六)
广东省预制菜产业链及产业园概况
中国预制菜行业省份发展竞争力分析:山东(一)
中国预制菜行业省份发展竞争力分析:山东(二)
中国预制菜行业省份发展竞争力分析:山东(三)
中国预制菜行业省份发展竞争力分析:山东(四)
中国预制菜行业省份发展竞争力分析:山东(五)
中国预制菜行业省份发展竞争力分析:山东(六)
山东省预制菜产业园区概况
中国预制菜行业省份发展竞争力分析:河南(一)
中国预制菜行业省份发展竞争力分析:河南(二)
中国预制菜行业省份发展竞争力分析:河南(三)
中国预制菜行业省份发展竞争力分析:河南(四)
中国预制菜行业省份发展竞争力分析:河南(五)
中国预制菜行业省份发展竞争力分析:河南(六)
河南省预制菜产业园区概况
八.中国预制菜行业重点企业经营分析
中国预制菜行业典型案例:味知香(一)
中国预制菜行业典型案例:味知香(二)
中国预制菜行业典型案例:味知香(三)
中国预制菜行业典型案例:味知香(四)
中国预制菜行业典型案例:味知香(五)
中国预制菜行业典型案例:味知香(六)
中国预制菜行业典型案例:安井食品(一)
中国预制菜行业典型案例:安井食品(二)
中国预制菜行业典型案例:安井食品(三)
中国预制菜行业典型案例:安井食品(四)
中国预制菜行业典型案例:安井食品(五)
中国预制菜行业典型案例:安井食品(六)
中国预制菜行业典型案例:千味央厨(一)
中国预制菜行业典型案例:千味央厨(二)
中国预制菜行业典型案例:千味央厨(三)
中国预制菜行业典型案例:千味央厨(四)
中国预制菜行业典型案例:千味央厨(五)
中国预制菜行业典型案例:千味央厨(六)
中国预制菜行业典型案例:国联水产(一)
中国预制菜行业典型案例:国联水产(二)
中国预制菜行业典型案例:国联水产(三)
中国预制菜行业典型案例:国联水产(四)
中国预制菜行业典型案例:国联水产(五)
中国预制菜行业典型案例:国联水产(六)
中国预制菜行业典型案例:温氏股份(一)
中国预制菜行业典型案例:温氏股份(二)
中国预制菜行业典型案例:温氏股份(三)
中国预制菜行业典型案例:温氏股份(四)
中国预制菜行业典型案例:温氏股份(五)
中国预制菜行业典型案例:深粮贝格厨房(一)
中国预制菜行业典型案例:深粮贝格厨房(二)
中国预制菜行业典型案例:深粮贝格厨房(三)
中国预制菜行业典型案例:广州酒家(一)
中国预制菜行业典型案例:广州酒家(二)
中国预制菜行业典型案例:广州酒家(三)
中国预制菜行业典型案例:广州酒家(四)
中国预制菜行业典型案例:广州酒家(五)
中国预制菜行业典型案例:正大集团(一)
中国预制菜行业典型案例:正大集团(二)
中国预制菜行业典型案例:正大集团(三)
中国预制菜行业典型案例:正大集团(四)
九.中国预制菜行业发展前景与趋势预测
中国预制菜市场发展规模预测
中国预制菜产品发展趋势分析:种类多样
中国预制菜产品发展趋势分析:打造爆品
中国预制菜产品发展趋势分析:品质升级
中国预制菜行业发展趋势分析:下沉市场空间大
中国预制菜行业发展趋势分析:业态多元化
中国预制菜行业发展趋势分析:产业规范化
图表:
图表1 预制菜相关国家政策
图表2 预制菜相关地方政策
图表3 中国预制菜行业团体
图表4 中国预制菜行业标准类别
图表5 中国预制菜行业标准
图表6 1978-2022年中国居民人均可支配收入情况
图表7 1998-2022年中国居民人均食品烟酒消费支出
图表8 2015-2025年中国餐饮业收入及预测
图表9 2006-2022年年末中国常住人口城镇化率
图表10 2016年-2021年“一人户”在家庭户中所占比例
图表11 中国城镇单位女性就业人员变化
图表12 2023年中国消费者购买预制菜次数较上一年变化
图表13 中国餐饮行业成本分布
图表14 买纯食材与使用预制菜成本对比
图表15 中国预制菜全流程关键加工技术示意图
图表16 2022年7月中国预制菜生产加工技术创新情况
图表17 2016-2025年中国冷链物流市场规模及预测
图表18 2016-2022年中国冷库总容量和冷藏车保有量
图表19 中国粮食、蔬菜产量
图表20 中国肉类、水产产量
图表21 2015-2022年中国海水、淡水产品产量
图表22 2014-2021年中国鱼类海水产品和淡水产品产量
图表23 2013-2021年中国虾类产量
图表24 2018-2023年中国小龙虾行业总产值及预测
图表25 2022年中国小龙虾养殖产量分布省份TOP5
图表26 2013-2021年中国蟹类产量
图表27 2015-2021年中国贝类海水产品和淡水产品产量
图表28 2015年-2022年中国猪、牛、羊存栏量
图表29 2011-2022年预制菜企业注册数量
图表30 2022年预制菜企业区域分布情况
图表31 2022年中国预制菜企业注册资本分布情况
图表32 2022年预制菜区域典型企业
图表33 2022年中国预制菜品牌百强榜
图表34 2019-2026年中国预制菜行业市场规模及预测
图表35 2019-2026年中国肉禽预制菜行业市场规模及预测
图表36 2019-2026年中国水产预制菜行业市场规模及预测
图表37 2019-2026年中国米面、蔬菜类预制菜行业市场规模及预测
图表38 预制菜重点企业产销情况
图表39 2022年7月-2023年6月京东平台预制菜销量
图表40 2022年7月-2023年6月京东平台预制菜热销品牌TOP20
图表41 2022年7月-2023年6月京东平台预制菜热销店铺TOP20
图表42 2022年7月-2023年6月京东平台预制菜热销商品TOP20
图表43 2020-2025年中国酸菜鱼预制菜行业市场规模及预测
图表44 2022年中国火锅消费者喜爱的火锅单品调查
图表45 2019-2026年中国虾滑食品市场规模及预测
图表46 2022-2023年中国预制菜行业典型投融资事件
图表47 2017-2027年中国在线餐饮外卖市场规模及预测
图表48 2017-2022年中国外卖占全国餐饮收入占比
图表49 2016-2022年中国外卖相关企业新增数量
图表50 2018-2022年在线外卖用户规模及使用率
图表51 2013-2022年中国餐饮连锁化率
图表52 2015-2023年中国连锁餐饮企业门店数及同比增长率预测
图表53 2022年中国连锁餐饮门店分布情况
图表54 2016-2022年中国连锁餐饮行业市场规模
图表55 2017-2023年中国团餐市场规模及预测
图表56 2019年中国团餐企业供应商数量区间分布
图表57 2010-2022年中国星级酒店数量
图表58 2018-2022年中国广义婚庆行业市场规模
图表59 中国代表性饭店品牌
图表60 酒店菜主要企业规模
图表61 2023年消费者购买预制菜产品频率
图表62 2023年消费者预制菜购买品类
图表63 2023年水产类预制菜消费品类
图表64 2023年水产类预制菜消费者单次消费金额
图表65 2023年水产类预制菜消费者单份可接受价格
图表66 2023年畜禽类预制菜产品消费品类
图表67 2023年畜禽类预制菜消费渠道
图表68 2023年畜禽类预制菜消费场景
图表69 2023年小吃糕点类预制菜菜品TOP10
图表70 2023年小吃糕点类预制菜品牌购买情况
图表71 2023年消费者对预制菜的喜好程度
图表72 2023年消费者预制菜菜系偏好
图表73 2023年消费者购买预制菜产品的原因
图表74 2023年消费者购买预制菜考虑因素
图表75 2023年消费者购买预制菜顾虑因素
图表76 2023年消费者认为预制菜行业未来需改进方面
图表77 2023年消费者认为预制菜行业的发展前景
图表78 2022年中国各省预制菜产业发展水平排行榜
图表79 2015年-2022年广东省常住人口数量
图表80 2015年-2022年广东省人均可支配收入及人均消费支出
图表81 广东省预制菜行业动态
图表82 2019-2022年全国及广东省预制菜企业数量
图表83 2015年-2022年广东省粮食及蔬菜产量
图表84 2015年-2022年广东省水产品及肉类产量
图表85 2015年-2022年山东省常住人口数量
图表86 2015年-2022年山东省人均可支配收入及人均消费支出
图表87 山东省预制菜行业动态
图表88 截至2023年6月山东省预制菜企业发展概况
图表89 2015年-2022年山东省粮食及蔬菜产量
图表90 2015年-2022年山东省水产品及肉类产量
图表91 2015年-2022年河南省常住人口数量
图表92 2015年-2022年河南省人均可支配收入及人均消费支出
图表93 河南省预制菜行业动态
图表94 2023年河南预制菜企业榜单
图表95 2015年-2022年河南省粮食及蔬菜产量
图表96 2015年-2022年河南省水产品及肉类产量
图表97 味知香旗下品牌及产品系列
图表98 2020-2022年味知香营收额
图表99 2020-2022年味知香营收主要产品构成比例
图表100 味知香研发体系
图表101 2016-2022年味知香研发费用
图表102 2022年味知香销售渠道类型
图表103 味知香布局预制菜的优势及挑战分析
图表104 2018年-2021年安井食品营业收入及增速
图表105 2022年安井食品各系列产品营业收入
图表106 2018年-2022年安井食品研发费用
图表107 2018年-2022年安井食品专利申请个数
图表108 2022年安井食品销售渠道结构
图表109 安井食品布局预制菜的优势及挑战分析
图表110 2018年-2022年千味央厨营业收入及增速
图表111 2018年-2022年千味央厨各类型预制菜产品营业收入
图表112 2018年-2022年千味央厨研发费用
图表113 2021-2022年千味央厨研发人员数量
图表114 千味央厨布局预制菜的优势及挑战分析
图表115 国联水产发展历程
图表116 2018-2022年国联水产总收益及同比增长率
图表117 2018-2022年国联水产净利润及同比增长率
图表118 2018-2022年国联水产研发费用
图表119 2018-2022年国联水产研发人员数量
图表120 国联水产产业链
图表121 国联水产布局预制菜的优势及挑战分析
图表122 温氏股份发展历程
图表123 2018-2022年温氏股份总收益及同比增长率
图表124 2018-2022年温氏股份归母净利润及同比增长率
图表125 2018-2022年温氏股份研发费用
图表126 温氏股份技术成果
图表127 温氏股份产业链
图表128 温氏股份布局预制菜的优势及挑战分析
图表129 2018-2022年深粮控股总收益及同比增长率
图表130 2018-2022年深粮控股归母净利润及同比增长率
图表131 深粮贝格厨房布局预制菜的优势及挑战分析
图表132 2018-2022年广州酒家总收益及同比增长率
图表133 2018-2022年广州酒家归母净利润及同比增长率
图表134 2022年广州酒家各产品类型营业收入及毛利率
图表135 2018-2022年广州酒家各类产品产量
图表136 广州酒家布局预制菜的优势及挑战分析
图表137 正大食品企业荣誉
图表138 正大食品产业链
图表139 正大集团布局预制菜的优势及挑战分析
图表140 预制菜关键需求指标
图表141 2022年中国预制菜消费者口味还原度评价
图表142 2023年各级城市消费者在预制菜不同喜欢程度中的占比
图表143 预制菜业态多元化
Figure 1\tNational policies related to prefabricated dishes
Figure 2 Local policies related to prefabricated vegetables
Figure 3 Chinese Prefabricated Vegetable Industry Group
Figure 4 Standard Categories of Chinese Prefabricated Vegetable Industry
Figure 5 Industry Standards for Prefabricated Vegetables in China
Figure 6 Per capita disposable income of Chinese residents from 1978 to 2022
Figure 7\tChina's per capita consumption expenditure on food, tobacco and alcohol from 1998 to 2022
Figure 8\tIncome of China’s Catering Industry and Forecast from 2015 to 2025
Figure 9 Urbanization rate of China's permanent population at the end of 2006 to 2022
Figure 10\tThe proportion of \"one person household\" in households in 2016-2021
Figure11 Change of Female Employees in Urban Units in China
Figure 12\tThe Number of Chinese Consumers Buying Prefabricated Vegetables Changed Compared With the Previous Year In 2023
Figure 13\tCost Distribution of China's Catering Industry
Figure 14\tCost comparison between purchasing pure ingredients and using pre made vegetables
Figure 15 Key Processing Techniques for Chinese Prefabricated Vegetables
Figure 16\tTechnological Innovation of Pre-made Food Production and Processing in China in July 2022
Figure 17\tScale and Forecast of China's Cold Chain Logistics Market from 2016 to 2025
Figure18 Total Capacity of Cold Storage and Number of Refrigerated Vehicles in China from 2016 to 2022
Figure 19 China's grain and vegetable output
Figure 20 China's grain and vegetable output
Figure 21 Production of seawater and freshwater products in China, 2015-2022
Figure 22 Production of Marine and freshwater fish products in China from 2014 to 2021
Figure 23 Production of shrimp in China, 2013-2021
Figure 24 Total Output Value and Forecast of Crayfish Industry in China from 2018 to 2023
Figure 25 In 2022, China's crayfish farming production distribution province TOP5
Figure 26 Crab production in China, 2013-2021
Figure 27\tProduction of Marine and freshwater shellfish products in China from 2015 to 2021
Figure 28\tStock of pigs, cattle and sheep in China in 2015-2022
Figure 29\tRegistered Number of Pre-made Food Enterprises from 2011 to 2022
Figure 30 Regional Distribution of Pre-made Food Enterprises in 2022
Figure 31 Distribution of Registered Capital of Chinese Prefabricated Vegetable Enterprises in 2022
Figure 32 Regional Typical Enterprises of Pre-made Food in 2022
Figure 33 Top 100 Chinese Pre-made Food Brands in 2022
Figure 34 Market Scale and forecast of China's Prefabricated Vegetable Industry from 2019 to 2026
Figure 35 Market Scale and forecast of China's Pre-made Poultry Food Industry from 2019 to 2026
Figure 36 Market Size and Forecast of Chinese Aquatic Prepared Vegetable Industry 2019-2026
Figure 37 Market Size and Forecast of China's Rice Noodle and Vegetable Prefabricated Vegetable Industry from 2019 to 2026
Figure 38 Production and sales situation of key prefabricated vegetable enterprises
Figure 39 Sales of prefabricated dishes on JD platform from July 2022 to June 2023
Figure 40 July 2022- June 2023 Top 20 Hot Selling Brands of JD Prefabricated Vegetables
Figure 41 July 2022- June 2023 Top 20 JD Prefabricated Vegetable Hot Selling Stores
Figure 42 Top 20 best-selling products of JD's pre made vegetables from July 2022 to June 2023
Figure 43 Actual and Estimated Market Scale of China’s Sauerkraut Fish Prefabricated Food from 2020 to 2025
Figure 44 Hotpot Consumers' Favorite Hotpot Single Product Survey in 2022
Figure 45 Market size and forecast of shrimp slime food in China from 2019 to 2026
Figure 46 Investment and Financing Trends of China's Prepared Vegetable Industry from 2022 to 2023
Figure 47 Scale and Forecast of China's Online Catering Delivery Market from 2017 to 2027
Figure 48 China's takeaway accounted for the share of national catering revenue in 2017-2022
Figure 49 Number of new takeout related enterprises in China from 2016 to 2022
Figure 50 Size and usage rate of online delivery users from 2018 to 2022
Figure 51 China's Catering Chain ization Rate from 2013 to 2022
Figure 52 Prediction of the number of stores and year-on-year growth rate of Chinese chain catering enterprises from 2015 to 2023
Figure 53 Distribution of Chain Catering Stores in China in 2022
Figure 54 Market size of China's chain catering industry from 2016 to 2022
Figure 55 Market Scale and Forecast of Chinese Group Meal in 2017-2023
Figure 56 Interval distribution of the number of suppliers of group meal companies in China
Figure 57 Number of star rated hotels in China from 2010 to 2022
Figure 58 Market size of China's broad wedding industry from 2018 to 2022
Figure 59 Representative Chinese Hotel Brands
Figure 60 Main enterprise scale of hotel cuisine
Figure 61 Frequency of Consumers Buying Prefabricated Vegetable Products in 2023
Figure 62 Consumer Prefabricated Vegetable Purchase Category in 2023
Figure 63 2023 Aquatic Prefabricated Vegetable Consumer Category
Figure 64 Single Consumption Amount of Aquatic Prefabricated Vegetable Consumers in 2023
Figure 65 Acceptable prices for single serving of aquatic pre made vegetables for consumers in 2023
Figure 66 Consumer categories of prefabricated livestock and poultry products in 2023
Figure 67 Consumption channels for prefabricated livestock and poultry dishes in 2023
Figure 68 Consumption Scenarios of Prefabricated Livestock and Poultry Vegetables in 2023
Figure 69 2023 Top 5 Prefabricated Dishes and Dishes for Snacks and Pastries
Figure 70 Purchase status of pre made snack and pastry brands in 2023
Figure 71 Users' Preference for Prefabricated Dishes in 2023
Figure 72 Consumer preferences for pre made dishes in 2023
Figure 73 Reasons for Consumers to Purchase Prefabricated Vegetable Products in 2023
Figure 74 Considerations for Consumers to Purchase Prefabricated Vegetables in 2023
Figure 75 Factors Concerned by Consumers about Purchasing Prefabricated Vegetables in 2023
Figure 76 Consumers believe that the prefabricated vegetable industry needs improvement in the future In 2023
Figure 77 Consumers believe in the development prospects of the pre made vegetable industry in 2023
Figure 78 Ranking of the Development Level of Prefabricated Vegetable Industry in Various Provinces of China in 2022
Figure 79 Number of Permanent Residents in Guangdong Province from 2015 to 2022
Figure 80 Per capita disposable income and per capita consumption expenditure in Guangdong Province from 2015 to 2022
Figure 81 Trends in the Prefabricated Vegetable Industry in Guangdong Province
Figure 82 Number of Prefabricated Vegetable Enterprises in China and Guangdong Province from 2019 to 2022
Figure 83 Grain and vegetable production in Guangdong Province from 2015 to 2022
Figure 84 Production of Aquatic Products and Meat in Guangdong Province from 2015 to 2022
Figure 85 Number of Permanent Residents in Shandong Province from 2015 to 2022
Figure 86 Per capita disposable income and per capita consumption expenditure in Shandong Province from 2015 to 2022
Figure 87 Trends in the Prefabricated Vegetable Industry in Shandong Province
Figure 88 Overview of the Development of Shandong Prefabricated Vegetable Enterprises
Figure 89 Grain and vegetable production in Shandong Province from 2015 to 2022
Figure 90 Production of Aquatic Products and Meat in Shandong Province from 2015 to 2022
Figure 91 Number of Permanent Residents in Henan Province from 2015 to 2022
Figure 92 Per capita disposable income and per capita consumption expenditure in Henan Province from 2015 to 2022
Figure 93 Trends in the Prefabricated Vegetable Industry in Henan Province
Figure 94 List of Henan Prefabricated Vegetable Enterprises in 2023
Figure 95 Grain and vegetable production in Henan Province from 2015 to 2022
Figure 96 Production of Aquatic Products and Meat in Henan Province from 2015 to 2022
Figure 97 Weizhixiang's brands and product Series
Figure 98 Revenue of Weizhixiang from 2020 to 2022
Figure 99 Proportion of main products in Weizhixiang's revenue from 2020 to 2022
Figure 100 Research and Development System of Weizhixiang
Figure 101 Research and Development Expenses of weizhixiang from 2016 to 2022
Figure 102 2022 Weizhixiang Sales Channel Types
Figure 103 Advantages and challenges of weizhixiang
Figure 104 Operating income and growth rate of Anjoy in 2018-2022
Figure 105 Operating revenue of various series of products of Anjoy in 2022
Figure 106 Research and development expenses of Anjoy in 2018-2022
Figure 107 Number of patent applications for Anjoy in 2018-2022
Figure 108 Sales channel structure for Anjoy in 2022
Figure 109 Advantages and challenges of Anjoy
Figure 110 Operating revenue and growth rate of Qianweiyangchu in 2018-2022
Figure 111 2018-2022 Qianweiyangchu's revenue from various types of prefabricated vegetable products
Figure 112 Research and development expenses of Qianweiyangchu in 2018-2022
Figure 113 Number of R&D personnel for Qianweiyangchu from 2021 to 2022
Figure 114 Advantages and challenges of Qianweiyangchu
Figure 115 Development History of Guolian Aquatic Products
Figure 116 Total Income and Growth Rate of Guolian Aquatic Products in 2018-2022
Figure 117 Net Profit and Growth Rate of Guolian Aquatic Products in 2018-2022
Figure 118 Research and development expenses of Guolian Aquatic Products from 2018 to 2022
Figure 119 The Number of Research and Development Personnel of Guolian Aquatic Products from 2018 to 2022
Figure 120 The Industrial Chain of Guolian Aquatic Products
Figure 121 Advantages and challenges of Guolian Aquatic Products
Figure 122 Development history of Wens Foodstuff Group
Figure 123 Total income and year-on-year growth rate of Wens Foodstuff Group from 2018 to 2022
Figure 124 Net profit attributable to parent company and year-on-year growth rate of Wens Foodstuff Group from 2018 to 2022
Figure 125 Research and development expenses of Wens Foodstuff Group from 2018 to 2022
Figure 126 Technical achievements of Wens Foodstuff Group
Figure 127 Wens Foodstuff Group industrial chain
Figure 128 Advantages and challenges of Wens Foodstuff Group
Figure 129 Total revenue and year-on-year growth rate of Shenzhen Cereals Holdings from 2018 to 2022
Figure 130 Net profit attributable to parent company and year-on-year growth rate of Shenzhen Cereals Holdings from 2018 to 2022
Figure 131 Advantages and challenges of Shenzhen Cereals Holdings
Figure 132 Total revenue and year-on-year growth rate of Guangzhou Restaurant from 2018 to 2022
Figure 133 Net profit attributable to parent company and year-on-year growth rate of Guangzhou Restaurant from 2018 to 2022
Figure 134 Operating revenue and Gross margin of Guangzhou Restaurant by product type in 2022
Figure 135 Production of various products at Guangzhou Restaurant from 2018 to 2022
Figure 136 Advantages and challenges of Guangzhou Restaurant
Figure 137 Honors of Charoen Pokphand Foods
Figure 138 Charoen Pokphand Foods Industry Chain
Figure 139 Advantages and challenges of Charoen Pokphand Foods
Figure 140 Key demand indicators of prefabricated vegetables
Figure 141 Evaluation of Flavor Reductions of Chinese Prefabricated Vegetable Consumers in 2022
Figure 142 The proportion of consumers at all levels of cities in different preferences for prefabricated dishes in 2023
Figure 143 Diversified Formats of Prefabricated Dishes
","groupId":0,"discount":"1.0","srcFile":"","iimediaUrl":"http://www.iimedia.cn/94577.html","readCount":22883,"reportType":0,"reportAuthor":"艾媒餐饮研究院","activityId":0,"isSubscribed":0,"activityTitle":"单身经济","price":25999.0,"id":43329,"isShowDownload":0,"reportLbImg":[],"publishTime":1678778513000,"visit_count":132257,"hasFile":1,"fileSize":30268854,"couponList":[],"shareUrl":"https://report.iimedia.cn/m-report.jsp?forWxShare=1&reportId=43329&sCode=BFAA231D87903BD9C1B0CDCADBCE4141&extT=","img":"https://img.iimedia.cn/10001fb3a09d0db8de926229f878ce18114df1dc6483a5efa9b594f4f3e5fb77971ff","groupType":0,"vipReportInfo":[{"id":62999,"raw":0,"payMode":1,"reportType":0,"pages":0,"equipType":0,"isOrderByIn":0,"toInfoPage":0,"offset":0,"count":10,"hasFile":0,"page":1,"isNewSearch":0,"title":"艾媒咨询 | 2025年中国电商“双十一”消费大数据监测报告","total":0,"op":0,"moduleType":3},{"id":57853,"raw":0,"payMode":1,"reportType":0,"pages":0,"equipType":0,"isOrderByIn":0,"toInfoPage":0,"offset":0,"count":10,"hasFile":0,"page":1,"isNewSearch":0,"title":"艾媒咨询 | 2025-2026年中国本地生活服务市场竞争格局和消费调查研究报告","total":0,"op":0,"moduleType":3},{"id":57852,"raw":0,"payMode":1,"reportType":0,"pages":0,"equipType":0,"isOrderByIn":0,"toInfoPage":0,"offset":0,"count":10,"hasFile":0,"page":1,"isNewSearch":0,"title":"艾媒咨询 | 2025年中国高考及院校录取分数大数据分析报告","total":0,"op":0,"moduleType":3},{"id":46744,"raw":0,"payMode":1,"reportType":0,"pages":0,"equipType":0,"isOrderByIn":0,"toInfoPage":0,"offset":0,"count":10,"hasFile":0,"page":1,"isNewSearch":0,"title":"艾媒咨询 | 2025年中国年份普洱茶行业现状及消费趋势洞察报告","total":0,"op":0,"moduleType":3},{"id":46687,"raw":0,"payMode":1,"reportType":0,"pages":0,"equipType":0,"isOrderByIn":0,"toInfoPage":0,"offset":0,"count":10,"hasFile":0,"page":1,"isNewSearch":0,"title":"艾媒咨询 | 2025年中国月子中心消费者行为调查数据","total":0,"op":0,"moduleType":3},{"id":46688,"raw":0,"payMode":1,"reportType":0,"pages":0,"equipType":0,"isOrderByIn":0,"toInfoPage":0,"offset":0,"count":10,"hasFile":0,"page":1,"isNewSearch":0,"title":"艾媒咨询 | 2025年中国预制鸡排消费行为调查数据","total":0,"op":0,"moduleType":3},{"id":46689,"raw":0,"payMode":1,"reportType":0,"pages":0,"equipType":0,"isOrderByIn":0,"toInfoPage":0,"offset":0,"count":10,"hasFile":0,"page":1,"isNewSearch":0,"title":"艾媒咨询 | 2025年中国服饰产品消费行为调查数据","total":0,"op":0,"moduleType":3},{"id":46690,"raw":0,"payMode":1,"reportType":0,"pages":0,"equipType":0,"isOrderByIn":0,"toInfoPage":0,"offset":0,"count":10,"hasFile":0,"page":1,"isNewSearch":0,"title":"艾媒咨询 | 2025年中国小程序电商用户消费行为调查数据","total":0,"op":0,"moduleType":3},{"id":46685,"raw":0,"payMode":1,"reportType":0,"pages":0,"equipType":0,"isOrderByIn":0,"toInfoPage":0,"offset":0,"count":10,"hasFile":0,"page":1,"isNewSearch":0,"title":"艾媒咨询 | 2025年中国第三方网络招聘平台使用行为调查数据","total":0,"op":0,"moduleType":3},{"id":46684,"raw":0,"payMode":1,"reportType":0,"pages":0,"equipType":0,"isOrderByIn":0,"toInfoPage":0,"offset":0,"count":10,"hasFile":0,"page":1,"isNewSearch":0,"title":"艾媒咨询 | 2025年中国化妆品消费者行为调查数据","total":0,"op":0,"moduleType":3}],"discountPrice":16147.0,"vipDiscountPrice":9688.2,"title":"艾媒咨询 | 2023-2025年中国预制菜行业运行及投资决策分析报告","reportGroupList":"","shareContent":"","isDeleted":0,"typeList":[{"typeName":"行业研究报告","id":1}],"imContent":"
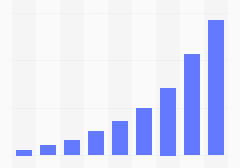
随着国家、地方政策的颁布,预制菜成为地方政府搞活经济,助力农产品深加工的重要抓手。大量的社会资源和社会资本涌入预制菜产业,行业业态逐渐呈现多元化发展态势。iiMedia Research(艾媒咨询)数据显示,2022年中国预制菜市场规模为4196亿元,同比增长21.3%,预计未来中国预制菜市场保持较高的增长速度,2026年预制菜市场规模将达10720亿元。现阶段,预制菜行业细分品类仍有较大机遇。但随着市场竞争激烈,消费者对品质和口感的要求越来越高,预制菜企业需要不断提升产品质量和创新能力,以满足消费者的需求,并抓住市场机遇。(《艾媒咨询 | 2023-2025年中国预制菜行业运行及投资决策分析报告》完整高清PDF版共205页,可点击文章底部报告下载按钮进行报告下载)
\r\nWith the promulgation of national and local policies, prefabricated vegetables have become an important tool for local governments to revitalize the economy and assist in the deep processing of agricultural products. A large amount of social resources and capital have flooded into the pre made vegetable industry, and the industry is gradually showing a diversified development trend. According to data from iiMedia Research, the size of China's pre made vegetable market in 2022 was 419.6 billion yuan, a year-on-year increase of 21.3%. It is expected that the Chinese pre made vegetable market will maintain a high growth rate in the future, and the pre made vegetable market size will reach 1072 billion yuan in 2026. At present, there are still significant opportunities for sub categories in the pre made vegetable industry. But with fierce market competition, consumers' demands for quality and taste are becoming increasingly high. Prefabricated vegetable enterprises need to continuously improve product quality and innovation capabilities to meet consumer needs and seize market opportunities.(“iiMedia Report | Analysis Report on the Operation and Investment Decision of China's Prefabricated Vegetable Industry in 2023-2025”full version has 205 pages, please click the download button at the bottom of the article to download the report)
\r\n核心观点
\r\n市场规模:2022年中国预制菜市场规模达4196亿元,2026年将达10720亿元
\r\niiMedia Research(艾媒咨询)数据显示,2022年中国预制菜市场规模为4196亿元,同比增长21.3%,预计未来中国预制菜市场保持较高的增长速度,2026年预制菜市场规模将达10720亿元。预制菜有效地降低了餐厅运营成本,顺应了当下消费者便捷、营养的饮食需求,吸引各大连锁餐饮品牌入行布局。
\r\n市场洞察:49.8%的预制菜消费者购买次数增多;水产类预制菜较受欢迎
\r\niiMedia Research(艾媒咨询)数据显示,约六成的消费者认为传统烹饪方式耗费时间太长、太麻烦;45.4%的消费者购买预制菜的原因是“节省烹饪时间”;49.8%的中国预制菜消费者在2022年消费预制菜次数增多。在预制菜购买品类方面,消费者最爱购买水产类预制菜,占比为75.3%,其次畜禽类、小吃糕点类预制菜也受到消费者的喜爱。
\r\n发展趋势:预制菜行业业态多元化、规范化发展趋势明显
\r\n中国菜品种类繁多,各地区饮食结构不同,单一企业难以全面覆盖,细分品类仍有较大机遇,行业业态逐渐呈现多元化发展态势。随着国家对预制菜行业的重视,各地方政府、团体、企业陆续推出预制菜行业标准,进一步推动行业规范化发展。
\r\n以下为报告内容节选:
\r\n预制菜行业定义及术语
\r\n预制菜指以食用农产品及其制品为主要原料,添加或不添调味料等辅料,经净化、切分、调味、烹饪/熟制、包装、杀菌等全部或部分工序及不同工序顺序的预制处理并在一定条件下贮运,可即食和非即食的菜肴等食品,包括预制菜品、预制汤羹和预制餐食。
\r\n预制菜行业分类
\r\n预制菜行业可按照加工程度以及原辅料来划分,可以分成即配食品、即烹食品以及即热食品。即配食品为经过清洗、切配加工,但未经过调味腌制的蔬菜、肉禽等产品。即烹食品为经过调味、裹粉、预炸等工序的半成品。即热食品为经过调味、腌制的菜品进一步炒制、蒸煮后的熟制品,再以速冻的方式保存。
\r\n预制菜行业发展历程
\r\n中国预制菜行业政策环境分析:国家政策
\r\n近年来,中国政府陆续出台一系列法律法规,对食品生产、加工、流通环节进行规范,并建立了食品安全追溯机制,为预制菜行业提供了良好的发展基础。
\r\n中国预制菜行业政策环境分析:地方政策(一)
\r\n当前,食品消费已产生新变化,符合当前形势的预制菜行业站上了消费风口。各地为了推动预制菜行业健康发展,基于当地实际情况与独特优势,推出了不同的新政策。其中包括保障预制菜质量与安全,和推动预制菜产业扩大市场规模等多方面的措施。
\r\n中国预制菜行业政策环境分析:地方政策(二)
\r\n中国预制菜行业政策环境分析:行业组织
\r\n近年来,随着国家相关政策的支持及预制菜行业兴起,全国各省、市陆续建立起预制菜行业团体以凝聚各方资源、团结各方人才,共同推动预制菜行业发展。
\r\n中国预制菜行业政策环境分析:行业标准(一)
\r\n随着预制菜行业的发展,行业竞争激烈,也引起了大众对预制菜原材料、添加剂、口味等问题的关注。为规范行业发展,各地方政府、行业团体、企业纷纷出台一系列标准,对预制菜的生产、加工、质量等提出相关规定。然而,当前预制菜行业仍缺乏国家级的行业标准,统一的标准体系亟待建立。
\r\n中国预制菜行业政策环境分析:行业标准(二)
\r\n在目前已发布的行业标准中,各标准侧重点各有不同,主要包括技术规范标准、加工标准、预制菜术语、定义和分类标准、预制菜质量评价与安全标准等,对预制菜产业发展起到推动作用。
\r\n中国预制菜产业链图谱
\r\n中国预制菜产业链概况
\r\n中国预制菜产业链上游分析:粮食及蔬菜
\r\n数据显示,1949年-2022年,中国粮食产量总体呈现上升趋势,近五年粮食产量增速放缓,总产量保持稳定;1995年-2022年,中国蔬菜产量逐年递增,2022年我国蔬菜产量达到79100.0万吨。中国农作物综合机械化率逐年提高,农业生产逐步实现自动化、智能化,利于预制菜行业发展。
\r\n中国预制菜产业链上游分析:肉类及水产总量
\r\n数据显示,1979年-2022年,中国肉类产量总体呈现上升趋势。近两年,受非洲猪瘟等因素叠加影响,肉类产量略有下降,目前处于恢复态势,肉类总产量充足稳定;1949年-2022年,中国水产产量保持增长,2022年达到6869.0万吨。拥有较强供应链能力的预制菜企业将获得市场先发优势,如真牛馆一类拥有全球优质牛肉产品企业,从源头提高了预制菜消费者的食用体验。
\r\n中国预制菜产业链中游分析:传统预制菜企业模式
\r\n传统预制菜企业以料理包、速冻调理生制品、厨师菜产品为主,具有专业性强的特性,能够针对B端做定制化产品,C端聚焦爆品打造。此类企业渠道运营、产品打造的经验丰富,但通常只有一两个工厂,规模较小,仅专注于最擅长的2-3 个品类,客户较集中,工厂自动化程度不高。
\r\n中国预制菜产业链中游分析:速冻食品企业模式
\r\n传统速冻食品企业主打标准化产品,爆品打造能力强,主要为厨师菜、速冻调理生制品、油炸制品。优势是擅长生产标准化商品,具有规模化优势、渠道分销能力优势和品牌优势。劣势是与原有渠道需要整合嫁接,定制化能力不强。
\r\n中国预制菜产业链中游分析:餐饮企业模式
\r\n餐饮企业主要面向C端消费者,以线下门店堂食为主,随着新零售渠道兴起,逐步拓展线上渠道,如广州酒家和同庆楼均在京东旗舰店销售预制菜产品。预制菜产品多以自家品牌推出,自带品牌效应,以火锅企业海底捞为例,公司推出的自热火锅产品凭借强大的品牌力,快速取得一定的市场占有率。但餐饮企业处于中下游位置,供应链程度较浅,受原材料价格波动影响较大。
\r\n全球预制菜行业发展历程及主要国家发展概况
\r\n中国预制菜市场规模发展空间
\r\niiMedia Research(艾媒咨询)数据显示,2022年中国预制菜市场规模为4196亿元,同比增长21.3%,预计未来中国预制菜市场将保持较高的增长速度,2026年预制菜市场规模将达10720亿元。预制菜有效地降低了餐厅运营成本,顺应了当下消费者便捷、营养的饮食需求,吸引了各大连锁餐饮品牌入行布局。
\r\n中国预制菜细分市场分析:肉禽预制菜
\r\niiMedia Research(艾媒咨询)数据显示,2022年中国肉禽预制菜行业规模为1224亿元,同比增长25.3%,预计未来中国肉禽预制菜市场规模将持续扩大,2026年肉禽预制菜市场规模将达3289亿元。随着人们生活条件改善,肉制品市场的需求量将持续上升,且上涨速度加快。
\r\n中国预制菜细分市场分析:水产预制菜
\r\niiMedia Research(艾媒咨询)数据显示,2022年中国水产预制菜行业规模为1047亿元,同比增长22.3%,预计2026年水产预制菜市场规模将达2576亿元。随着人们饮食的多元,消费结构的升级,水产预制菜市场将持续扩大规模。
\r\n中国预制菜细分市场分析:米面/蔬菜类预制菜
\r\niiMedia Research(艾媒咨询)数据显示,2022年中国米面、蔬菜类预制菜行业市场规模为1925亿元,同比增长18.4%,预计2026年中国米面、蔬菜类预制菜行业市场规模将达4855亿元。米面、蔬菜构成人们基本饮食结构,米面、蔬菜类预制菜行业将持续扩大市场规模以满足消费者需要。
\r\n中国预制菜爆款单品研究分析:酸菜鱼
\r\n酸菜鱼预制菜市场火热,多品牌入局推广,通过直播电商推动酸菜鱼预制菜C端市场快速发展。酸菜鱼成为预制菜行业典型爆款产品。iiMedia Research(艾媒咨询)数据显示,中国酸菜鱼预制菜市场在2022年迎来高速增长,市场规模突破100亿元,预计2025年将达到204.7亿元。
\r\n中国预制菜爆款单品研究分析:虾滑
\r\n在食品工业转型升级及消费驱动下,虾滑消费场景得到跨越式发展,消费市场势头向好。iiMedia Research(艾媒咨询)数据显示,2019-2022年,受消费市场影响中国虾滑食品市场规模略有波动,2022年市场规模为100.6亿元。随着提振消费相关政策不断出台,消费市场回暖,预计2026年中国虾滑食品市场规模达173.1亿元,消费需求将促进上游鲜虾养殖、中游虾滑加工厂产业链条的搭建与延伸。在市场集中度较低,头部优势不明显的背景下,蓝海竞争充满可能性,虾滑供应企业不断涌现。
\r\n中国预制菜B端重点市场:连锁餐饮行业
\r\niiMedia Research(艾媒咨询)数据显示,新一线城市中连锁餐饮企业的门店分布得最多,占比达到23%;其次一线城市也相对较多,占比达11%。总体而言,二线及以上等级的城市累计达到55%的比重。它们的经济实力、居民消费能力远远强于其他城市,餐饮连锁企业纷纷在该地布局。
\r\n中国预制菜消费者画像分析
\r\n中国消费者水产预制菜购买金额及价格接受度
\r\niiMedia Research(艾媒咨询)数据显示,超过六成的消费者水产类预制菜消费金额在50元-299元之间。其中,28.0%的消费者单次消费金额为100-199元之间,24.0%的消费者单次消费金额在200-299元内。在水产类预制菜单份可接受的价格方面,超六成的人认为单份31-70元最佳。艾媒咨询分析师认为,随着经济的发展,消费结构的改变,预计未来消费者在预制菜上的消费金额将持续增加。
\r\n中国预制菜行业省份发展竞争力分析:广东
\r\n数据显示,2015-2022年,广东省常住人口数不断上升,从2015年的11678万人上升至2022年的12657万人。经济的发达、落户政策的优化等都吸引了大量人才入户广东,促进广东省常住人口的持续增长。广东省人口量大,日常消耗食品量大,具备较强的预制菜产品消费潜力。
\r\n中国预制菜行业典型案例:千味央厨
\r\n数据显示,2017年-2022年,千味央厨研发费用投入逐年增多。其中,2022年的研发费用为1584.8万元,同比增长 76.29%。与此同时,2022 年千味央厨研发人员达到73 人,同比增加了 73.81%。近年来各大预制菜企业愈发重视产品研发,试图抢占预制菜赛道先机,占据市场份额。
\r\n2023-2025年中国预制菜行业趋势分析简要概括(详细趋势分析请查阅完整版报告)
\r\n中国预制菜行业发展趋势分析:下沉市场空间大
\r\niiMedia Research(艾媒咨询)数据显示,在对预制菜非常喜欢的人群中,一线和新一线城市人群居多,分别占比为35.2%和24.1%;对预制菜比较喜欢的人群中,将近80%的人属于一线、新一线城市及二线城市;不太喜欢预制菜的人群中,75%的人来自二三线城市。当前,一线、新一线城市经济水平较高,生活节奏快,对预制菜接受程度较好;二、三级城市经济水平相对较弱,生活节奏相对较慢,对预制菜的需求不高。随着下沉市场消费观念的改变、对预制菜认识的加深,预制菜行业在下沉市场同样有较大的发展空间。
\r\n本文内容节选自艾媒咨询发布的《艾媒咨询|2023-2025年中国预制菜行业运行及投资决策分析报告》,完整版报告共205页,点击文末下方链接可直达完整版报告。
","chartNum":143,"categoryList":[{"id":17,"categoryName":"餐饮"}],"isShowOnLineReadUrl":"","summary":"","shareUrlQrCode":"data:image/png;base64,iVBORw0KGgoAAAANSUhEUgAAAMgAAADICAYAAACtWK6eAAAE/UlEQVR42u3d24rcMBAE0Pn/n07eAyEsUXeVNKdgn3aY8UXH0JLd/vwSkb/m4xCIACICiAggIoCIACICiAggIoCIACIigIgAIgKICCAigIgAIgKICCB/ftHns/o3/fv/+v7//f3t4/vT7/vp/rePD0AAAQQQQAABBBBA3gdyvFgaPoHp7d0GPL09beMDEEAAAQQQQAABBJDvA9I+ALZBbhf96SI+PT4AAQQQQAABBBBAAAFke6Hu9P6lF+JOf/72hVZAAAEEEEAAAQQQQABJH4DpAXQa2PbNmdNFNiCAAAIIIIAAAggggKSBpAGmB1h60qFt0mJ7fAACCCCAAAIIIIAA8j6QdNMG/7+7CNfVBBBAAAHE/wEBxP8BeT3pm/nSC5fTkwTXjgs0AAEEEEAAAQQQQGqBTDcV2B4Q25MUbQN0evvSjewAAQQQQAABBBBAAPm+94O0gWhdqNrav/T5TTfyAwQQQAABBBBAAAHkPiBtC2/pRnJtzaWnB1T6AgIIIIAAAggggAACyPcBmV5oay8C2196ud1koa3JBCCAAAIIIIAAAggggGw3M94e4NuTEqfBjw+85QsqIIAAAggggAACCCDvAZkGMQ3y9Oent/+1SYr0BQwQQAABBBBAAAEEkPeK9LYBsQ08/UKc2yc5UguLgAACCCCAAAIIIIC8C2R7IW76AG+/MGa6CG47H19XpAMCCCCAAAIIIIAAMl6kpZsupBfq2hvTbQPbKsoBAQQQQAABBBBAALkXyHZRv31C21/4k745NH2BAQQQQAABBBBAAAHkfSDphbPbfr990qNtEuP08QUEEEAAAQQQQAAB5PuAtBWBqYWo1EJpasC1LQQCAggggAACCCCAAPIOkNubJtz+ktBbHkhqAwEIIIAAAggggAACyDtA0s2pb2sqkW7q0N5c+/ru7oAAAggggAACCCCArBdZ2zfLpT8/ffzaboZsG0+AAAIIIIAAAggggACSLuLbX+hz+6TB9ID+uiIdEEAAAQQQQAABBJDjgNqbX7c3iWi/ObStqAcEEEAAAQQQQAAB5D0gr71EM71/2zf33d6oDxBAAAEEEEAAAQQQQE4Xge0Ddru5dHpSpA00IIAAAggggAACCCBe4plu7NZW9LeBf+18AQIIIIAAAggggACiN+/2CUg3MUgv3LU13z79eUAAAQQQQAABBBBAAEk/ANT2gNT059MXkNvPFyCAAAIIIIAAAggg9wOZPsDbAyK9/dP73zYp0dY8GxBAAAEEEEAAAQSQ+4GsL/A81nht+2bBtubU1y8UAgIIIIAAAggggAByHEj6JZrbReB2o7O2B6a2z0+qsRwggAACCCCAAAIIINZBThV16Qes0kC3G7ulL7CAAAIIIIAAAggggLwHpL0Iayvyp4vy9hf6tO0PIIAAAggggAACCCD3A9kuwtsekEpfcE4fv21w6fEGCCCAAAIIIIAAAsj9QF5/4Ge76E1vT3pSBhBAAAEEEEAAAQQQQNqKwNtuxks3gnvt5kVAAAEEEEAAAQQQQABpK8rat6dt+9tfUAQIIIAAAggggAACCCDHF2yGT/j0wtn2pEJ60uD0BXQaLCCAAAIIIIAAAggg+mJtNwXYLiq3i+LtSZf0pA4ggAACCCCAAAIIIO8DEXkxgIgAIgKICCAigIgAIgKICCAigIgAIiKAiAAiAogIICKAiAAiAojIM/kNcu099rMmrikAAAAASUVORK5CYII=","module_type":1,"memberPrice":16147.0,"introduce":"2022年中国预制菜市场规模为4196亿元,同比增长21.3%,预计未来中国预制菜市场保持较高的增长速度,2026年预制菜市场规模将达10720亿元。现阶段,预制菜行业细分品类仍有较大机遇,行业业态逐渐呈现多元化发展态势。各地方政府、团体、企业陆续推出预制菜行业标准,行业规范化发展趋势明显。","isPublished":1,"filePath":"20230719/【完整版】2023-2025年中国预制菜行业运行及投资决策分析报告.pdf","updateTime":1733305848000,"pageNum":205,"labelList":[{"id":18668,"labelName":"预制菜"},{"id":23468,"labelName":"预制菜企业"},{"id":22246,"labelName":"预制菜行业"},{"id":37676,"labelName":"预制菜投资"},{"id":37174,"labelName":"政策"},{"id":37175,"labelName":"行业术语"},{"id":37176,"labelName":"主管单位"},{"id":37177,"labelName":"行业标准"},{"id":37178,"labelName":"地方标准"},{"id":37179,"labelName":"团体标准"},{"id":37180,"labelName":"企业标准"},{"id":37181,"labelName":"宏观经济"},{"id":4472,"labelName":"技术"},{"id":37182,"labelName":"真空和面"},{"id":37183,"labelName":"微米急冻锁鲜"},{"id":5856,"labelName":"益生菌"},{"id":37184,"labelName":"发酵"},{"id":37185,"labelName":"非油炸面饼"},{"id":37186,"labelName":"超高压非热加工"},{"id":37187,"labelName":"畜牧"},{"id":9783,"labelName":"养殖业"},{"id":10036,"labelName":"蔬菜"},{"id":6960,"labelName":"种植业"},{"id":1414,"labelName":"水产"}],"isShowOnLineRead":0,"seourl":"https://report.iimedia.cn/repo17-0/43329.html","shareTitle":"","showPrice":25999.0,"createTime":1677674715000,"freePages":10,"md5":"1c5946bf63347738e7689936fea5436b"},"isInShopCart":0,"acList":[],"isCollectCategory":false,"isCollected":0,"isBought":0},"isStop":0,"name":"艾媒咨询 | 2023-2025年中国预制菜行业运行及投资决策分析报告"}, industryInfo={nodeStat=0, name=餐饮食品, is_end=0, pid=31026926, type=7, name_id=null, node_id=44278057, sort_id=3}, nodeInfo={name=艾媒咨询 | 2023-2025年中国预制菜行业运行及投资决策分析报告, isCollect=0, isSub=0, type=5, nodeId=49224921}}}}" />短信登录
中国+86
中国+86
一周内保持登录创建/忘记密码?
- {{ item.name }}

地址:
中国. 广州大学城
总机:
020-8922-4700
数据背书
用数据说话,为增长导航
范围:市场地位证明;联合白皮书;品宣报告;标杆案例;竞争情报;奖项参与等相关事项咨询
例如:大数据验证全球/全国销量(额)第一/领先;品类首创/开创者;第一品牌等市场地位确认服务;数据/报告的第三方背书用途(品宣方向)
180-2235-3365
艾媒智库
范围:会员购买;消费调查;商城报告;内参报告定制等相关事项咨询
例如:想了解商城报告/数据/会员的购买疑问;用户(消费)行为调查;定制内部决策用报告(内参方向)
020-8922-4416 或 181-0273-0697
加入社群
加入艾媒行业实名交流群,获取最新市场咨询、行业数据、合作资源;
目前已开通新科技、新消费及大文娱、大健康、新零售、未来教育、餐饮、快消等超10大领域产业链社群,欢迎业界人士加入。
媒体合作
艾媒分析师记者采访、媒体约稿;内容转载授权;媒体资源置换合作。
news@iimedia.cn
网站投稿
用于投稿、新闻线索收集、爆料及同类信息交互需求,为用户提供便捷的内容提交与反馈通道。
news@iimedia.cn
订阅邮件
50W+ 行业精英每周必读的行业数据报告
行业大类选择我们将会根据您的喜好为您定向推送内容。
邮箱我们将会根据您的喜好为您定向推送内容。
搜索热词:


{{ userDotCount > 99 ? '99+' : userDotCount }}
![]()
![]()
智库VIP
未开通开通会员,免费浏览海量数据
-
报告中心
-
我的收藏
-
我的发票
-
个人中心
{{ userDotCount > 99 ? '99+' : userDotCount }} -
金鹰计划
-
帮助中心


点击按相关度搜索
展示停更数据
 会员数据
会员数据
所属行业:餐饮食品


根据CC准则,此许可证向用户授予以下权利:署名来源;禁止修改;允许商业转载。Attribution-NoDerivatives
4.0国际公共许可证
更多信息
在线咨询
刷新图表
标题设置
字体大小
数值显示
刻度设置
图片属性
- 图表
- 列表
- 媒体图表
下载
PNG
XLS
PPT
显示数值
联合logo
图表展示:
全部时间
- 全部时间
- 最近一周
- 最近一月
- 最近半年
- 最近一年
- 最近三年
- 最近五年
图表展示:
图表展示:
(拖动上方滑块改变图表横轴范围)
去投融数据库看详细数据 >>
多年同列只支持月频或季频指标
| 时间 | 数据(亿元) |
|---|
| 最近浏览数据 | 更新频度 | 单位 | 来源 | 最新数据 | 更新时间 | 注释说明 | 轴线设置 | 线形设置 | 颜色设置 | 设置 |
|---|
查看更多
其他相关数据