全球领先的新经济产业第三方数据挖掘与分析机构
1.中国知识付费行业定义
2.中国知识付费行业崛起背景驱动分析
3.中国知识付费商业模式分析
4.中国知识付费行业发展历程
5.中国知识付费行业发展驱动力:政策环境
6.中国知识付费行业发展驱动力:经济环境
7.中国知识付费行业发展驱动力:社会环境(一)
8.中国知识付费行业发展驱动力:社会环境(二)
9.中国知识付费行业发展驱动力:社会环境(三)
10.中国知识付费行业发展驱动力:社会环境(四)
11.中国知识付费行业发展驱动力:技术环境(一)
12.中国知识付费行业发展驱动力:技术环境(二)
二、中国知识付费行业发展核心数据分析
1.2015-2025年中国知识付费消费者规模及预测
2.2015-2025年中国知识付费市场规模及预测
3.中国知识付费行业新增企业数量规模分析
4.中国知识付费行业投融资动态
5.中国知识付费行业投融资情况(一)
6.中国知识付费行业投融资情况(二)
7.中国知识付费行业投融资情况(三)
8.中国知识付费行业投融资情况(四)
三、中国知识付费产业链重要环节剖析
1.中国知识付费产业图谱
2.中国知识付费内容生产模式对比
3.中国知识付费运行平台对比分析
4.中国知识付费企业竞争情报案例:腾讯课堂(企业概况)
5.中国知识付费企业竞争情报案例:腾讯课堂(核心优势)
6.中国知识付费企业竞争情报案例:腾讯课堂(商业模式)
7.中国知识付费企业竞争情报案例:腾讯课堂(消费者画像)
8.中国知识付费企业竞争情报案例:腾讯课堂(商情舆情)
9.中国知识付费企业竞争情报案例:得到(企业概况)
10.中国知识付费企业竞争情报案例:得到(核心优势)
11.中国知识付费企业竞争情报案例:得到(运营概况)
12.中国知识付费企业竞争情报案例:得到(消费者画像)
13.中国知识付费企业竞争情报案例:得到(商情舆情)
14.中国知识付费企业竞争情报案例:樊登读书(商业模式)
15.中国知识付费企业竞争情报案例:樊登读书(核心优势)
16.中国知识付费企业竞争情报案例:樊登读书(消费者画像)
17.中国知识付费企业竞争情报案例:樊登读书(商情舆情)
18.中国知识付费企业竞争情报案例:樊登读书(企业概况)
19.中国知识付费企业竞争情报案例:知乎(企业概况)
20.中国知识付费企业竞争情报案例:知乎(运营概况)
21.中国知识付费企业竞争情报案例:知乎(核心优势)
22.中国知识付费企业竞争情报案例:知乎(消费者画像)
23.中国知识付费企业竞争情报案例:知乎(商情舆情)
24.中国知识付费企业竞争情报案例:英语流利说(企业概况)
25.中国知识付费企业竞争情报案例:英语流利说(运营概况)
26.中国知识付费企业竞争情报案例:英语流利说(核心优势)
27.中国知识付费企业竞争情报案例:英语流利说(消费者画像)
28.中国知识付费企业竞争情报案例:英语流利说(商情舆情)
29.中国知识付费企业竞争情报案例:喜马拉雅(企业概况)
30.中国知识付费企业竞争情报案例:喜马拉雅(运营概况一)
31.中国知识付费企业竞争情报案例:喜马拉雅(运营概况二)
32.中国知识付费企业竞争情报案例:喜马拉雅(消费者画像)
33.中国知识付费企业竞争情报案例:喜马拉雅(商情舆情)
四、中国知识付费消费者行为调研分析
1.中国知识付费消费者平台消费者画像
2.中国知识付费消费者平台使用分布
3.中国知识付费消费者知识焦虑感知、消费意愿
4.中国知识付费消费者消费金额
5.中国知识付费消费者购买预期、推荐意向
6.中国知识付费消费者学习内容分布
7.中国知识付费消费者学习频率、课程形式
8.中国不同群体购买知识付费比例
9.中国“35岁+”知识付费消费者画像
10.中国知识付费调研“35岁+”群体地域分布
11.中国知识付费调研“35岁+”群体使用平台类型、考虑因素
12.中国“35岁+”群体各年龄段知识付费平台类型
13.中国“35岁+”群体各年龄段知识付费平台考虑因素TOP5
14.中国“35岁+”群体使用知识付费平台的原因
15.中国“35岁+”群体各年龄段知识付费平台使用原因TOP3
16.中国“35岁+”群体使用知识付费产品类型
17.中国“35岁+”群体各年龄段知识付费产品类型TOP3
18.“35岁+”群体最近一年在知识付费服务上的支出
19.中国“35岁+”群体各年龄段最近一年在知识付费上的支出
20.中国“35岁+”群体使用知识付费服务平台的时间
21.中国“35岁+”群体各年龄段使用知识付费服务平台的时间
五、2022-2023年中国知识付费行业发展困境与趋势
1.中国知识付费行业发展困境(一)
2.中国知识付费行业发展困境(二)
3.2022-2023年中国知识付费行业发展趋势(一)
4.2022-2023年中国知识付费行业发展趋势(二)
图表
图表 1\t中国文化娱乐产业矩阵图
图表 2\t中国知识付费行业相关政策法规
图表 3\t2002-2021年中国居民人均消费支出及人均教育文化娱乐支出
图表 4\t2012-2020年中国文化产业增加值及占GDP比重
图表 5\t2021年中国居民人均消费支出构成比
图表 6\t2021年中国网民年龄结构
图表 7\t2018-2022年3月中国CIER指数
图表 8\t2015-2022年中国高校毕业生人数及城镇新增就业人数
图表 9\t2017-2021年中国手机网民规模及其占网民比例
图表 10\t2017-2021年中国网络支付消费者规模及使用率
图表 11\t2015-2025年中国知识付费消费者规模及预测
图表 12\t2015-2025中国知识付费市场规模及预测
图表 13\t2012-2022年中国知识付费行业新增企业数量
图表 14\t2021-2022年中国知识付费行业投融资动态
图表 15\t2009-2022年6月中国知识付费行业投融资概况
图表 16\t2009-2022年6月中国知识付费行业轮次投融资分布
图表 17\t2009-2022年6月中国知识付费行业地域投融资分布
图表 18\t2009-2022年6月中国知识付费行业投资机构
图表 19\t2020年中国知识付费用户对“知识春晚”收看情况
图表 20\t2020年中国知识付费用户对“知识春晚”的态度分布
图表 21\t2020年中国知识付费用户对“知识春晚”评价情况
图表 22\t腾讯课堂消费者画像
图表 23\t得到APP线上付费内容布局
图表 24\t2018-2020年得到新增付费消费者数量
图表 25\t2018-2020年思维造物营业收入
图表 26\t得到消费者画像
图表 27\t樊登读书知识付费布局
图表 28\t樊登读书消费者画像
图表 29\t知乎融资情况
图表 30\t知乎各项业务营收
图表 31\t知乎消费者画像
图表 32\t2016-2018年英语流利说平台月活跃消费者数量
图表 33\t2016-2018年流利说主要财务数据变化趋势
图表 34\t英语流利说消费者画像
图表 35\t喜马拉雅平台主要音频内容形式
图表 36\t2018-2021年3月喜马拉雅平均MAU
图表 37\t2018-2021年3月喜马拉雅平均每月活跃移动付费消费者及其支付比率
图表 38\t2018-2020年喜马拉雅FM累计专辑数
图表 39\t2018-2020年喜马拉雅FM人均日播放音轨量
图表 40\t喜马拉雅消费者画像
图表 41\t2022年知识付费消费者画像
图表 42\t2022年中国知识付费消费者使用平台分布
图表 43\t2022年中国知识付费消费者知识焦虑感知
图表 44\t2022年中国知识付费消费者消费意愿
图表 45\t2022年中国知识付费消费者每月消费金额
图表 46\t2022年中国知识付费消费者购买目的
图表 47\t2022年中国知识付费消费者购买预期
图表 48\t2022年中国知识付费消费者推荐意向
图表 49\t2022年中国知识付费消费者学习内容分布情况
图表 50\t2022年中国知识付费消费者学习频率分布
图表 51\t2022年中国知识付费消费者喜欢的课程呈现形式
图表 52\t2021年不同群体购买知识付费比例
图表 53\t2021年“35岁+”知识付费消费者画像
图表 54\t2021年“35岁+”群体使用知识付费平台类型
图表 55\t2021年“35岁+”群体选择知识付费平台所考虑的因素
图表 56\t2021年“35岁+”群体使用知识付费平台的原因
图表 57\t2021年“35岁+”群体使用知识付费产品类型
图表 58\t“35岁+”群体最近一年在知识付费服务上的支出
图表 59\t2021年“35岁+”群体每天使用知识付费服务平台的平均时间
Comment:
Figure 1\tMatrix Map of Chinese Culture and Entertainment Industry
Figure 2\tRelevant Policies and Regulations of China's Knowledge Payment Industry
Figure 3\tChina's Per Capita Consumption Expenditure and Per Capita Expenditure on Education, Culture and Entertainment from 2002 to 2021
Figure 4\t2012-2020 China's Cultural Industry Added Value and Its Share of GDP
Figure 5\t2021 Proportion of Per Capita Consumption Expenditure of Chinese Residents
Figure 6\tAge Structure of Chinese Internet Users in 2021
Figure 7\tChina CIER Index March 2018-2022
Figure 8\tNumber of College Graduates in China from 2015 to 2022
Figure 9\tScale and Proportion of Mobile Internet Users in China from 2017 to 2021
Figure 10\tScale and Utilization Rate of Online Payment Users in China from 2017 to 2021
Figure 11\t2015-2025 User Scale of Chinese Knowledge Paying Industry
Figure 12\t2015-2025 Market Scale of Chinese Knowledge Paying Industry
Figure 13\t2012-2022 Number of Startup Companies in Chinese Knowledge Paying Industry
Figure 14\tInvestment and Financing Trends of China's Knowledge Payment Industry from 2021 to 2022
Figure 15\tInvestment and Financing of Knowledge Payment Industry in China from 2009 to June 2022
Figure 16\tInvestment and Financing Distribution of Knowledge Payment Industry in China from 2009 to June 2022
Figure 17\tDistribution of Regional Investment and Financing in China's Knowledge Payment Industry from 2009 to June 2022
Figure 18\tChina Knowledge Payment Industry Investment Institutions from 2009 to June 2022
Figure 19\t2020 Distribution of Chinese Knowledge Paying Users Watching \"Knowledge Spring Festival Gala\"
Figure 20\t2020 Attitude Distribution of Chinese Knowledge Paying Users to \"Knowledge Spring Festival Gala\"
Figure 21\t2020 Attitude Distribution of Chinese Knowledge Paying Users Towards \"Knowledge Spring Festival Gala\"
Figure 22\tTencent Classroom Consumer Portrait
Figure 23\tOnline Paid Content Layout of Iget App
Figure 24\tNumber of New Paid Consumers in Dedao from 2018 to 2020
Figure 25\tSiweizaowu's Operating Income for 2018-2020
Figure 26\tDedao Classroom Consumer Portrait
Figure 27\tKnowledge Payment Layout of Fandeng Dushu
Figure 28\tFandnegdushu Consumer Portrait
Figure 29\tFinancing Activities of Zhihu
Figure 30\tRevenues from Various Businesses of Zhihu
Figure 31\tZhihu Consumer Portrait
Figure 32\t2016-2018 Number of Monthly Active Users of English Liulishuo
Figure 33\t2016-2018 Main Financial Data of Liulishuo
Figure 34\tLiulishuo’s Classroom Consumer Portrait
Figure 35\tMain Audio Content forms of Himalayan Platform
Figure 36\tAverage Himalayan MAU for March 2018-2021
Figure 37\tAverage Monthly Active Mobile Pay Consumers and Their Payment Ratio in the Himalayas, March 2018-2021
Figure 38\tCumulative Number of Himalayan FM albums from 2018 to 2020(thousands)
Figure 39\tHimalayan FM Per Capita Daily Broadcast Track Volume from 2018 to 2020
Figure 40\tXimalaya Consumer Portrait
Figure 41\tPortrait of Knowledge-Paying Consumers in 2022
Figure 42\t2022 Proportion of Various Knowledge Paying Platforms Used by Chinese Users
Figure 43\tKnowledge Anxiety Perceived by Chinese Knowledge-Paying Consumers in 2022
Figure 44\tConsumption Intention of Chinese Knowledge-Paid Consumers in 2022
Figure 45\tMonthly Consumption Amount of Knowledge-Paying Consumers in China in 2022
Figure 46\tPurchasing Purpose of Knowledge Paying Consumers in China 2022
Figure 47\tChina's Knowledge-Paid Consumer Purchase Expectations in 2022
Figure 48\tRecommendation Intention of Chinese Knowledge-Paid Consumers in 2022
Figure 49\tDistribution of Learning Content for Knowledge-Paid Consumers in China 2022
Figure 50\tDistribution of Learning Frequency of Knowledge-Paid Consumers in China in 2022
Figure 51\tCourse Presentation Form Favored by Chinese Knowledge-Paying Consumers in 2022
Figure 52\tProportion of Payment for Knowledge Purchased by Different Groups in 2021
Figure 53\tPortrait of \"35 + Knowledge Paying Users\" in 2021
Figure 54\tTypes of Knowledge Payment Platforms Used by \"35 +\" Groups in 2021
Figure 55\tFactors Considered in Choosing Knowledge Payment Platforms for the 35+ Group in 202
Figure 56\tReasons for \"35 + year olds\" to use the Knowledge Payment Platform in 2021
Figure 57\tTypes of Knowledge Payment Products used by \"35 +\" Group in 2021
Figure 58\tExpenditure of \"35 + years old\" Kroup on Knowledge Payment sServices in 2020
Figure 59\tThe Average Time that the \"35 + year old\" Group Uses the Knowledge Payment Service Platform Every day in 2021","groupId":0,"discount":"1.0","srcFile":"","iimediaUrl":"http://www.iimedia.cn/9.html","readCount":21919,"reportType":0,"reportAuthor":"艾媒新经济产业研究中心","activityId":0,"isSubscribed":0,"activityTitle":"","price":11999.0,"id":43243,"isShowDownload":0,"reportLbImg":[],"publishTime":1657004689000,"visit_count":1190849,"orgName":"","hasFile":1,"fileSize":6777223,"couponList":[],"shareUrl":"https://report.iimedia.cn/m-report.jsp?forWxShare=1&reportId=43243&sCode=BFAA231D87903BD9C1B0CDCADBCE4141&extT=","img":"https://img.iimedia.cn/100012b94f73f223cbea7eb6abe5265c2e8ccaa60c9569948f30c56a1128ef5e59b84","groupType":0,"vipReportInfo":[{"id":62999,"raw":0,"payMode":1,"reportType":0,"pages":0,"equipType":0,"isOrderByIn":0,"toInfoPage":0,"offset":0,"count":10,"hasFile":0,"page":1,"isNewSearch":0,"title":"艾媒咨询 | 2025年中国电商“双十一”消费大数据监测报告","total":0,"op":0,"moduleType":3},{"id":57853,"raw":0,"payMode":1,"reportType":0,"pages":0,"equipType":0,"isOrderByIn":0,"toInfoPage":0,"offset":0,"count":10,"hasFile":0,"page":1,"isNewSearch":0,"title":"艾媒咨询 | 2025-2026年中国本地生活服务市场竞争格局和消费调查研究报告","total":0,"op":0,"moduleType":3},{"id":57852,"raw":0,"payMode":1,"reportType":0,"pages":0,"equipType":0,"isOrderByIn":0,"toInfoPage":0,"offset":0,"count":10,"hasFile":0,"page":1,"isNewSearch":0,"title":"艾媒咨询 | 2025年中国高考及院校录取分数大数据分析报告","total":0,"op":0,"moduleType":3},{"id":46744,"raw":0,"payMode":1,"reportType":0,"pages":0,"equipType":0,"isOrderByIn":0,"toInfoPage":0,"offset":0,"count":10,"hasFile":0,"page":1,"isNewSearch":0,"title":"艾媒咨询 | 2025年中国年份普洱茶行业现状及消费趋势洞察报告","total":0,"op":0,"moduleType":3},{"id":46687,"raw":0,"payMode":1,"reportType":0,"pages":0,"equipType":0,"isOrderByIn":0,"toInfoPage":0,"offset":0,"count":10,"hasFile":0,"page":1,"isNewSearch":0,"title":"艾媒咨询 | 2025年中国月子中心消费者行为调查数据","total":0,"op":0,"moduleType":3},{"id":46688,"raw":0,"payMode":1,"reportType":0,"pages":0,"equipType":0,"isOrderByIn":0,"toInfoPage":0,"offset":0,"count":10,"hasFile":0,"page":1,"isNewSearch":0,"title":"艾媒咨询 | 2025年中国预制鸡排消费行为调查数据","total":0,"op":0,"moduleType":3},{"id":46689,"raw":0,"payMode":1,"reportType":0,"pages":0,"equipType":0,"isOrderByIn":0,"toInfoPage":0,"offset":0,"count":10,"hasFile":0,"page":1,"isNewSearch":0,"title":"艾媒咨询 | 2025年中国服饰产品消费行为调查数据","total":0,"op":0,"moduleType":3},{"id":46690,"raw":0,"payMode":1,"reportType":0,"pages":0,"equipType":0,"isOrderByIn":0,"toInfoPage":0,"offset":0,"count":10,"hasFile":0,"page":1,"isNewSearch":0,"title":"艾媒咨询 | 2025年中国小程序电商用户消费行为调查数据","total":0,"op":0,"moduleType":3},{"id":46685,"raw":0,"payMode":1,"reportType":0,"pages":0,"equipType":0,"isOrderByIn":0,"toInfoPage":0,"offset":0,"count":10,"hasFile":0,"page":1,"isNewSearch":0,"title":"艾媒咨询 | 2025年中国第三方网络招聘平台使用行为调查数据","total":0,"op":0,"moduleType":3},{"id":46684,"raw":0,"payMode":1,"reportType":0,"pages":0,"equipType":0,"isOrderByIn":0,"toInfoPage":0,"offset":0,"count":10,"hasFile":0,"page":1,"isNewSearch":0,"title":"艾媒咨询 | 2025年中国化妆品消费者行为调查数据","total":0,"op":0,"moduleType":3}],"discountPrice":3599.0,"vipDiscountPrice":2159.4,"title":"艾媒咨询|2022-2023年中国知识付费行业研究及消费者行为分析报告","reportGroupList":"","shareContent":"","isDeleted":0,"typeList":[{"typeName":"行业研究报告","id":1}],"imContent":"
2022年中国知识付费市场规模将达1126.5亿元,预计2025年市场规模达2808.8亿元。艾媒咨询分析师认为,经历了一段探索发展阶段后,中国知识付费平台已形成相对稳定的变现模式。知识付费内容日趋多元化,最初的专业化内容扩充至娱乐、社交类知识内容。消费者偏向知识付费产品解决实际的问题,用户愿意为获取专业内容而付费,为垂直领域的知识付费平台提供了发展契机。(《艾媒咨询 | 2022-2023年中国知识付费行业研究及消费者行为分析报告》完整高清PDF版共100页,可点击文章右侧浏览高清报告按钮进行报告浏览)
\r\nIn 2022, the market size of China's knowledge payment will reach 112.65 billion yuan, and the market size is expected to reach 280.88 billion yuan in 2025. Ai Media Consulting analysts believe that after a period of exploration and development, China's knowledge payment platform has formed a relatively stable monetization model. The content of paid knowledge is increasingly diversified, and the original specialized content expands to entertainment and social knowledge content. Consumers prefer knowledge-based payment products to solve practical problems, and users are willing to pay for professional content, providing opportunities for the development of knowledge-based payment platforms in vertical fields. (“iiMedia Report | China Knowledge Payment Industry Research and Consumer Behavior Analysis Report 2022-2023” full version has 100 pages,please click the Browse HD Report button on the right side of the article to browse the report)
\r\n核心观点
\r\n2022年中国知识付费市场规模将达1126.5亿元,2025年将达2808.8亿元
\r\n2022年中国知识付费市场规模将达1126.5亿元,预计2025年市场规模达2808.8亿元。艾媒咨询分析师认为,经历了一段探索发展阶段后,中国知识付费平台已形成相对稳定的变现模式。内容变现模式的形成和稳定有助于知识付费行业吸引更多不同领域的人才入场,从而丰富知识付费的内容和表现形式,进一步扩大市场发展可能性。
\r\n62.2%的中国知识消费者有知识方面的焦虑、担忧,80.1%的消费者持续购买知识付费产品
\r\n调研数据显示,62.2%的中国知识消费者认为自己有知识方面的焦虑、担忧;80.1%的消费者会继续购买知识付费类的产品。艾媒咨询分析师认为,消费者在精神和职业技能方面的需求不断提升,消费者对于知识付费方面的产品消费意愿较为强烈。消费者使用的知识付费平台前三名,分别为喜马拉雅、知乎和今日头条,分别占比62.1%、38.8%和30.4%,其次为腾讯视频、蜻蜓FM等。
\r\n知识付费行业朝多元化、垂直化方向发展,职业技能类知识需求有望提升
\r\n知识付费内容日趋多元化,最初的专业化内容扩充至娱乐、社交类知识内容。消费者偏向知识付费产品解决实际的问题,用户愿意为获取专业内容而付费,为垂直领域的知识付费平台提供了发展契机。数据显示,2022年,CIER指数持续下降,且51.3%的中国消费者购买知识产品是出于职业需求。新冠疫情冲击商业市场运行,市场就业压力激增,激发了提升职业技能的需求,市场规模不断扩大。
\r\n以下为报告内容节选:
\r\n中国知识付费行业定义
\r\n中国知识付费行业崛起背景驱动分析
\r\n中国居民人均可支配收入不断增加,消费结构从生存型向发展型转变,公众消费观念、时间观、效率观念的转变,越来越适应通过付费来获取一些知识,从而带动了知识付费行业相关产业的发展。目前中国知识付费行业已发展出视频、音频、直播、图文等丰富的产品形态。
\r\n中国知识付费行业发展驱动力:经济环境(一)
\r\n数据显示,2017-2021年中国居民人均可支配收入逐年增长,在教育文化娱乐方面的人均消费支出呈增长趋势。艾媒咨询分析师认为,随着人们生活水平的提高,在教育文化娱乐方面的需求越来越大,有利于知识付费行业的发展。
\r\n中国知识付费行业发展驱动力:经济环境(二)
\r\n近年来,随着中国经济实力的日益增强,文化产业得以快速发展,文化投资和消费水平也明显提高,中国文化产业的增加值及占GDP比重不断增长。艾媒咨询分析师认为,中国文化产业强有力的经济基础为知识付费行业提供巨大的发展机会。
\r\n中国知识付费行业发展驱动力:技术环境(一)
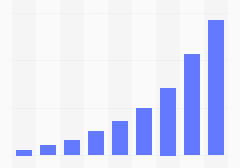
\r\n2015-2025年中国知识付费消费者规模及预测
\r\n数据显示,自2015年以来,中国知识付费行业用户规模从0.5亿人快速增长到2021年的4.8亿人。艾媒咨询分析师认为,居民消费不断升级,在精神层面、自我技能等方面的需求逐渐显现,愈来愈多的消费者愿意消费知识产品,以实现个人爱好、职场技能等方面的提升,预计2025年将突破6.4亿人。
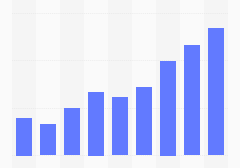
\r\n2015-2025年中国知识付费市场规模及预测
\r\n数据显示,2021年中国知识付费市场规模达675.0亿元,较2015年增长约42倍,预计2025年市场规模将突破2808.8亿元。艾媒咨询分析师认为,社会竞争压力激增,消费者通过自我提升化解知识焦虑,以及知识付费领域产品逐渐多元化、专业化,能满足更多消费者知识需求,预计2025年市场规模达2808.8亿元。
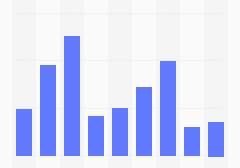
\r\n中国知识付费行业新增企业数量规模分析
\r\n艾媒咨询分析师认为,2012年至2022年,中国知识付费行业的相关企业数量不断增长,但增长速度有所放缓,行业逐渐进入平稳发展阶段。
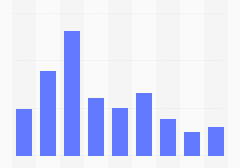
\r\n中国知识付费行业投融资情况(一)
\r\n数据显示,2009-2021年,中国知识付费行业投融资金额总体呈增长趋势,投融资数量在2017年达到顶峰,2021年投融资金额创新高,知识付费头部企业陆续上市。
\r\n中国知识付费热点事件:知识春晚(一)
\r\n中国知识付费产业图谱
\r\n中国知识付费内容生产模式对比
\r\n中国知识付费消费者消费者画像
\r\n中国知识付费消费者购买预期、推荐意向
\r\n调研数据显示,82.7%的中国知识消费者认为其购买过的知识付费产品比较符合或完全符合他们的期望;82.2%的消费者表示愿意将他们购买过的知识付费产品推荐给其他人。艾媒咨询分析师认为,中国消费者对知识付费产品满意度较高且愿意推荐给他人。
\r\n不同群体购买知识付费比例
\r\n调研数据显示,35岁以上的群体购买知识付费的比例为41.2%,其中,35-45岁群体占比40.1%,46-50岁群体占比12.8%。艾媒咨询分析师认为,“35岁+”群体已经普遍开始组建家庭,中年职场危机与家庭责任压力较大,面对事业、金钱、家庭、健康等重重关卡,通过知识付费的手段去获取信息和方法,缓解社会节奏加快所带来的焦虑。
\r\n2021年“35岁+”群体使用知识付费平台的原因
\r\n调研数据显示,53.6%的“35岁+”受访者使用知识付费平台的原因是期待学习新事物,42.9%的受访者则为希望解决生活中的实际问题;另外,被宣传内容吸引、排解孤独、丰富生活也是“35岁+”消费者使用知识付费平台的重要原因。
\r\n中国知识付费行业发展困境(一)
\r\n中国知识付费行业发展困境(二)
\r\n2022-2023年中国知识付费行业发展趋势(一)
\r\n知识付费群体向“35+”群体转移
\r\n调研数据显示,2021年“35岁+”群体购买知识付费的比例达到58.8%,其中主要购买者年龄范围为35-45岁。过往研究中较少关注的知识付费用户群体开始受到瞩目,尤其在“35岁+”群体的网络需求崛起后,他们成为知识付费的主要消费群体,对知识付费内容的偏好和消费能力的凸显正对知识付费行业产生深刻影响。
\r\n短视频渠道知识付费内容逐渐兴起
\r\n短视频内容丰富、覆盖群体广,发展至今,各大短视频平台的用户数量越来越大,用户的活跃度和用户粘性较高,各大短视频平台纷纷推出知识付费板块业务,短视频的知识付费内容正逐渐兴起。调研数据显示,2022年中国消费者最喜欢的课程形式中短视频类达56.8%,用户端对短视频类的知识付费内容逐渐提升。
\r\n2022-2023年中国知识付费行业发展趋势(二)
\r\n就业压力激增,激发职业技能类知识付费产品需求提升
\r\n调研数据显示,51.3%的中国消费者购买知识产品,是出于职业需求。新冠疫情冲击商业市场运行,导致就业市场岗位减少,高校毕业生逐年增多和行业跳槽等条件使得应聘人员就业压力激增。为了在就业市场获得招聘机会,知识付费产品成为应聘者提升竞争优势的有效工具,激发了知识付费职业技能提升的市场需求的上涨。
\r\n知识付费产品持续多元化、纵深化发展
\r\n知识付费内容的互联网相关产品日趋多元化,知识付费从商业财经、技能类型类向各个细分领域扩张,消费者对娱乐、人际关系等垂直领域的产品关注度越来越高。消费者更偏向知识付费产品解决实际的问题,用户愿意为获取专业内容而付费,为垂直领域的知识付费平台提供了发展契机。
\r\n本文内容节选自艾媒咨询发布的《艾媒咨询|2022-2023年中国知识付费行业研究及消费者行为分析报告》,完整版报告共100页,点击文末下方链接可直达完整版报告。
","chartNum":59,"categoryList":[{"id":120,"categoryName":"新兴信息产业"}],"isShowOnLineReadUrl":"","summary":"","shareUrlQrCode":"data:image/png;base64,iVBORw0KGgoAAAANSUhEUgAAAMgAAADICAYAAACtWK6eAAAE7klEQVR42u3dwY6bUAwF0Pz/T3f2I3UxCravzblSV7RpID5I5oH5/BOR/+bjEIgAIgKICCAigIgAIgKICCAigIgAIiKAiAAiAogIICKAiAAiAogIIL8/6PNp/fPt9/vr95/e32+Pz9Pb048XIIAAAggggAACCCDvA/J4sxRe4NXHI23/nwaYWn+AAAIIIIAAAggggOwFsr3g0oFVH/+04wkIIIAAAggggAACCCDTB6C7YNMLrPsEAwgggAACCCCAAAIIIJr02R88rUCrFxav1gcggAACCCCAAAIIIG5W7LpZr7pAq5vs6RNOWn0AAggggAACCCCAAHIfyPahBLbXbjfVBBDbAQHEdkAAsR2Qa6lueq8tXHY37WvqCBBAAAEEEEAAAQSQWCBpDyw9XTDpFxm+3Z9v/7+0iwKAAAIIIIAAAggggLwPSPW/T3/gKr2Aq0+A1Se4171ABxBAAAEEEEAAAQSQuCb62yavegjD9GC6tILdslAJCCCAAAIIIIAAAkgukKcLvPrzrzXFaYPZuh+AWv/AFCCAAAIIIIAAAggg7QtJ3QVS3XQ//QNO//tucOeHVwMCCCCAAAIIIIAAUt5kpoGabprTmtr0F+icu4oFCCCAAAIIIIAAAsj6pm3bQmH3C3GmTyBPg+gKIIAAAggggAACCCC5QKYPwPQLV9IuKkwvNG4fwgEIIIAAAggggAACyH4g1QW+ffh1GsD0B8jONemAAAIIIIAAAggggJQ35dM3D24fnJa+0Jh2syUggAACCCCAAAIIIPeBTIOYXnhMW5hLu1lxSwABBBBAAAEEEEAA2QukummcLpjuhcFukN2ff35oAyCAAAIIIIAAAggg9c3O8AFIK6BtC4vbb/YEBBBAAAEEEEAAAeR9QKoLprsAp4FPX1TY/kAZIIAAAggggAACCCD7gaQX+HSBpg1J2PbA1diJGxBAAAEEEEAAAQSQNesg1wombRh3+kWD6t/z/PBqQAABBBBAAAEEEEDav3D60IT0B5q6FwLT9wcQQAABBBBAAAEEkHtAqgu++4B3g0lbSJt+gdH5q1iAAAIIIIAAAggggIwvbHUXWPdCVTfgbfs7vTALCCCAAAIIIIAAAsg+IGlJf0HMtQeoppvs81NNAAEEEEAAAQQQQABpL+jpm+em/373QmraCcjwakAAAQQQQAABBBBAppuu6SY2rUCqC6h7MKAnCgEBBBBAAAEEEEAAmS7o7psbq5vytCEX0xclqo8PIIAAAggggAACCCDvA9K98JR+UWG6yS4vrOam+/xVLEAAAQQQQAABBBBAxpv06e+TfhFh+vPSho0DAggggAACCCCAAHIPyHTSC2q6qU1/qWrazamAAAIIIIAAAggggOxr0rubuGsPLG0bBp4OEBBAAAEEEEAAAQSQ+0Cqm/C0pjf95rv0mz+nB9cBAggggAACCCCAAHJ/Lta2Jm/LAz5Xmv7XNemAAAIIIIAAAggggKwHMj0YbvoiQzf47mjSAQEEEEAAAQQQQABJb9Kn9yd9aEX6MG9NOiCAAAIIIIAAAggg3TuQfhFg+vtX/17dC6UpYAABBBBAAAEEEEAA2QNkeihA+iCz7qZ4eghGStMNCCCAAAIIIIAAAsgdICIXA4gIICKAiAAiAogIICKAiAAiAogIICICiAggIoCIACICiAggIoCInMkPTaN5AUNy4awAAAAASUVORK5CYII=","module_type":1,"memberPrice":3599.0,"introduce":"2022年中国知识付费市场规模将达1126.5亿元,预计2025年市场规模达2808.8亿元。艾媒咨询分析师认为,经历了一段探索发展阶段后,中国知识付费平台已形成相对稳定的变现模式。","isPublished":1,"filePath":"20220630/【完整版】2022年中国知识付费行业运行发展及用户行为调研分析报告.pdf","updateTime":1657004976000,"pageNum":100,"labelList":[{"id":22921,"labelName":"知识付费行业"},{"id":1445,"labelName":"知识产权"},{"id":1505,"labelName":"腾讯课堂"},{"id":5706,"labelName":"文化产业"},{"id":9176,"labelName":"得到"},{"id":22212,"labelName":"樊登读书"},{"id":9046,"labelName":"知乎"},{"id":13042,"labelName":"英语流利说"},{"id":183,"labelName":"喜马拉雅"},{"id":14604,"labelName":"知识春晚"},{"id":1411,"labelName":"融资"},{"id":22922,"labelName":"知识焦虑"},{"id":22923,"labelName":"思维造物"},{"id":22924,"labelName":"CIER指数"},{"id":17197,"labelName":"网络支付"},{"id":22925,"labelName":"音频内容"},{"id":986,"labelName":"知识付费"}],"isShowOnLineRead":0,"seourl":"https://report.iimedia.cn/repo120-0/43243.html","shareTitle":"","showPrice":11999.0,"createTime":1651409115000,"freePages":10,"md5":"dac9afbd401a39faa858a0a832517e83"},"isInShopCart":0,"acList":[],"isCollectCategory":false,"isCollected":0,"isBought":0},"isStop":0,"name":"艾媒咨询|2022-2023年中国知识付费行业研究及消费者行为分析报告"}, industryInfo={nodeStat=2, name=教育消费, is_end=0, pid=31026926, type=7, name_id=null, node_id=31026940, sort_id=9}, nodeInfo={name=艾媒咨询|2022-2023年中国知识付费行业研究及消费者行为分析报告, isCollect=0, isSub=0, type=5, nodeId=44295408}}}}" />短信登录
中国+86
中国+86
一周内保持登录创建/忘记密码?
- {{ item.name }}

地址:
中国. 广州大学城
总机:
020-8922-4700
数据背书
用数据说话,为增长导航
范围:市场地位证明;联合白皮书;品宣报告;标杆案例;竞争情报;奖项参与等相关事项咨询
例如:大数据验证全球/全国销量(额)第一/领先;品类首创/开创者;第一品牌等市场地位确认服务;数据/报告的第三方背书用途(品宣方向)
180-2235-3365
艾媒智库
范围:会员购买;消费调查;商城报告;内参报告定制等相关事项咨询
例如:想了解商城报告/数据/会员的购买疑问;用户(消费)行为调查;定制内部决策用报告(内参方向)
020-8922-4416 或 181-0273-0697
加入社群
加入艾媒行业实名交流群,获取最新市场咨询、行业数据、合作资源;
目前已开通新科技、新消费及大文娱、大健康、新零售、未来教育、餐饮、快消等超10大领域产业链社群,欢迎业界人士加入。
媒体合作
艾媒分析师记者采访、媒体约稿;内容转载授权;媒体资源置换合作。
news@iimedia.cn
网站投稿
用于投稿、新闻线索收集、爆料及同类信息交互需求,为用户提供便捷的内容提交与反馈通道。
news@iimedia.cn
订阅邮件
50W+ 行业精英每周必读的行业数据报告
行业大类选择我们将会根据您的喜好为您定向推送内容。
邮箱我们将会根据您的喜好为您定向推送内容。
搜索热词:


{{ userDotCount > 99 ? '99+' : userDotCount }}
![]()
![]()
智库VIP
未开通开通会员,免费浏览海量数据
-
报告中心
-
我的收藏
-
我的发票
-
个人中心
{{ userDotCount > 99 ? '99+' : userDotCount }} -
金鹰计划
-
帮助中心


点击按相关度搜索
展示停更数据
 会员数据
会员数据
所属行业:教育消费


根据CC准则,此许可证向用户授予以下权利:署名来源;禁止修改;允许商业转载。Attribution-NoDerivatives
4.0国际公共许可证
更多信息
在线咨询
刷新图表
标题设置
字体大小
数值显示
刻度设置
图片属性
- 图表
- 列表
- 媒体图表
下载
PNG
XLS
PPT
显示数值
联合logo
图表展示:
全部时间
- 全部时间
- 最近一周
- 最近一月
- 最近半年
- 最近一年
- 最近三年
- 最近五年
图表展示:
图表展示:
(拖动上方滑块改变图表横轴范围)
去投融数据库看详细数据 >>
多年同列只支持月频或季频指标
| 时间 | 数据(亿元) |
|---|
| 最近浏览数据 | 更新频度 | 单位 | 来源 | 最新数据 | 更新时间 | 注释说明 | 轴线设置 | 线形设置 | 颜色设置 | 设置 |
|---|
查看更多
其他相关数据